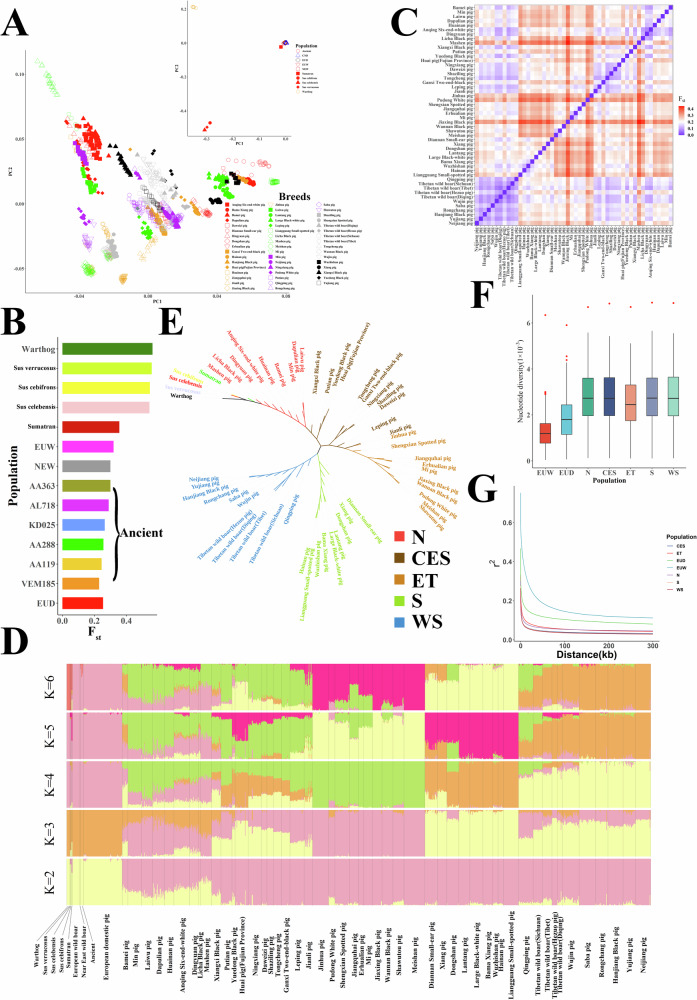
Fig. 3. Population structure analyses of Chinese domestic pig populations.
A PCA of Chinese domestic pig populations and other pig populations across Eurasia. CND: Chinese domestic pigs; EUD: European domestic pigs; EUW: European wild boars; NEW: wild boars from the Near East; Ancient: ancient pigs. B The Fst results between Chinese domestic pigs and other pig populations across Eurasia. C The Fst results among different Chinese domestic pig populations. D The genetic clustering analysis of pigs across Eurasian. E The phylogenetic tree of Chinese domestic pigs. F The nucleotide diversity for Chinese domestic pigs and European pigs. The nucleotide diversity was calculated for each population by a 1 Mb non-overlap window. The individuals in European pigs were divided into EUD (n = 74) and EUW (n = 13), while Chinese indigenous pigs were divided into N (n = 171), CES (n = 193), ET (n = 215), S (n = 179) and WS (n = 253). Boxplots show the median, 25th, and 75th percentile, the whiskers indicate the minima and maxima, and the points laying outside the whiskers of boxplots represent the outliers. G The LD decay for Chinese domestic pigs and European pigs.

