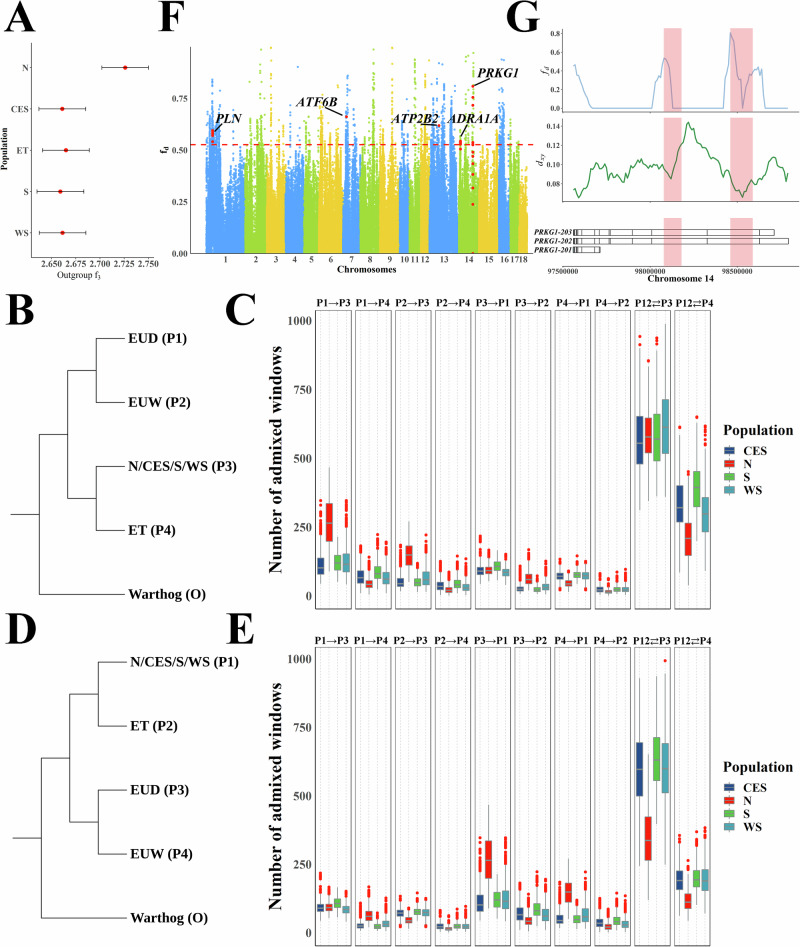
Fig. 4. Admixture between Chinese domestic pig and European pig.
A Outgroup f3 (European domestic pigs, X; Warthog) results for five distinct Chinese domestic pig sub-groups, where X represents the different sub-groups. The individuals of the Chinese domestic pig used in this analysis are the same as in Fig. 3F. The data points are presented as estimated f3 statistics ± s.e. The horizontal bars represent ± 1 s.e. B Schematic diagram of the topology used for the first configuration of the DFOIL analyses applied to population ET. C The DFOIL analyses results of the first configuration for population ET (n = 5 × 1 × 10 × 9 when P3 represents an individual from population N; n = 5 × 1 × 10 × 11 when P3 represents CES; n = 5 × 1 × 10 × 9 when P3 represents S; n = 5 × 1 × 10 × 11 when P3 represents WS). Boxplots show median, 25th and 75th percentile, the whiskers indicate the minima and maxima, and the points laying outside the whiskers of boxplots represent the outliers. D Schematic diagram of the topology used for the second configuration of the DFOIL analyses applied to population ET. E The DFOIL analyses results of the second configuration for population ET (n = 5 × 1 × 10 × 9 when P1 represents an individual from population N; n = 5 × 1 × 10 × 11 when P1 represents CES; n = 5 × 1 × 10 × 9 when P1 represents S; n = 5 × 1 × 10 × 11 when P1 represents WS). Boxplots show the median, 25th, and 75th percentile, the whiskers indicate the minima and maxima, and the points laying outside the whiskers of boxplots represent the outliers. F Degree of introgression from the ET population into European domestic pigs. Five important genes affected by the top introgression signals are shown. The dashed horizontal line indicates the top 1% fd. G Discrete introgression regions in the PRKG1 gene. The top plot shows the fd from ET to European domestic pigs. The middle plot shows the pairwise nucleotide differences per site (dxy) between ET and European domestic pigs. The bottom plot shows the gene structure.

