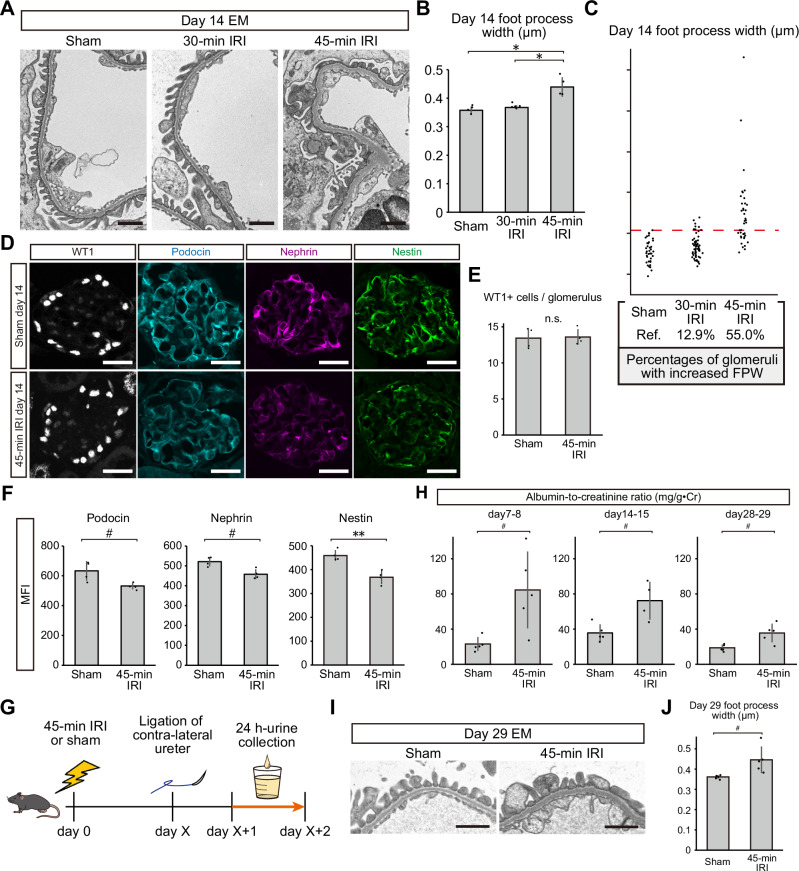
Fig. 1. Pathological changes in podocytes and albuminuria after ischemia reperfusion injury (IRI).
A Electron microscopy images of glomerular tufts 14 days after 30-min IRI, 45-min IRI, and sham surgery. B Podocyte foot process widths after each condition. Each dot represents the average foot process width of at least five glomeruli from each mouse. Exact p-values: Sham vs 45-min IRI: *p = 0.0003; 30-min IRI vs 45-minIRI: *p = 0.0005. C Percentages of glomeruli with an increased foot process width. Each dot represents the foot process width for each glomerulus. The dashed red line indicates the threshold of the normal foot process width defined as the largest foot process width in the sham surgery group. D Podocyte marker protein immunostaining (WT1, podocin, nephrin, and nestin) 14 days after 45-min IRI or sham surgery. E The number of WT1-positive cells per glomerulus after 45-min IRI or sham surgery. Exact p-value: p = 0.8623. F The mean fluorescence intensity (MFI) of podocin, nephrin, and nestin 14 days after 45-min IRI or sham surgery. Exact p-values: Podocin: #p = 0.0477; Nephrin: #p = 0.0100; Nestin: **p = 0.0027. G Graphical representation of the albumin-to-creatinine ratios (ACR) measurement in the urine from injured kidneys. H ACR on day 7–8, day 14–15, and day 28–29 after IRI or sham surgery. Exact p-value: day 7–8: #p = 0.0336; day 14–15: #p = 0.0346; day 28–29: #p = 0.0206. I Electron microscopy images of glomerular tufts 29 days after 45-min IRI and sham surgery. J Podocyte foot process widths 29 days after 45-min IRI and sham surgery. Exact p-value: #p = 0.0450. *p < 0.001; **p < 0.01; #p < 0.05. Scale bars: 1 μm in (A and I) and 20 μm in (D). EM, electron microscopy; IRI, ischemia reperfusion injury; FPW, foot process width; MFI, mean fluorescence intensity; n.s., not significant.

