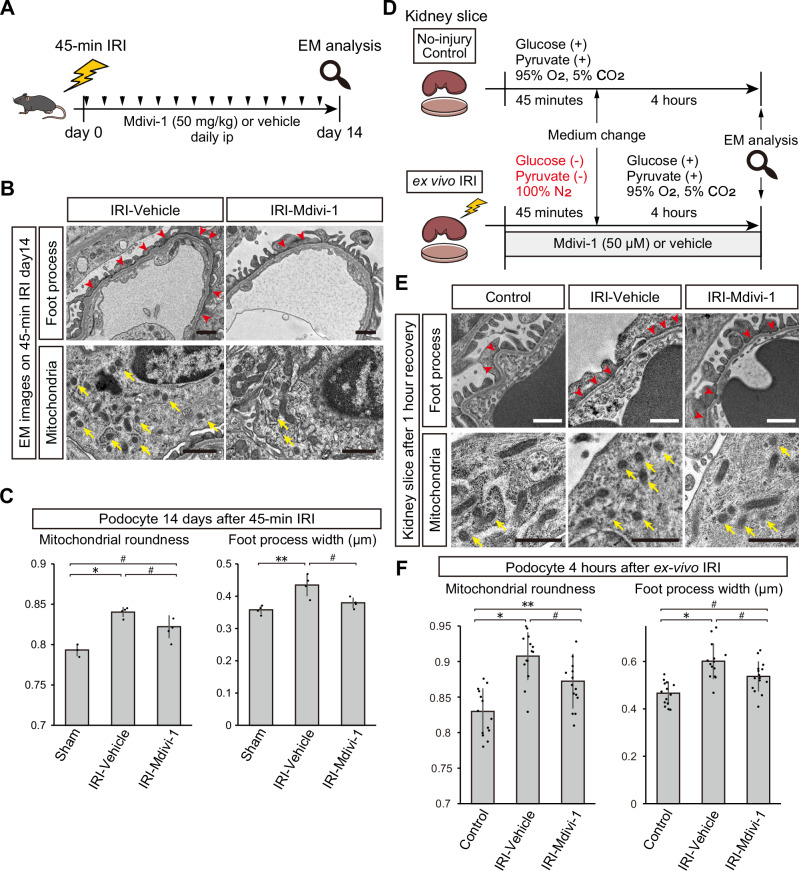
Fig. 10. Suppression of mitochondrial fission ameliorates podocyte cytoskeleton disarrangement in mice and slice cultured kidney.
A Graphical representation of the experimental design for (B and C). B TEM images of glomerular tufts 14 days after 45-min IRI with Mdivi-1 or vehicle treatment. Upper panels focus on foot processes (red arrows indicating foot process effacement), and lower panels on mitochondria (yellow arrows indicating fragmented mitochondria). C Mitochondrial roundness and foot process width of podocytes 14 days after 45-min IRI with Mdivi-1 or vehicle treatment, or sham surgery. Data of sham surgery group in Fig. 6B and C were shown again for comparison. Exact p-value: Sham vs Vehicle: *p = 0.0006; Sham vs Mdivi-1: #p = 0.0254; Vehicle vs Mdivi-1: #p = 0.0277 for the left graph and Sham vs Vehicle: **p = 0.0042; Vehicle vs Mdivi-1: #p = 0.0308 for the right graph. D Graphical representation of the experimental design for (E and F). E TEM images of glomerular tufts after ex vivo IRI with Mdivi-1 or vehicle treatment. Upper panels focus on foot processes (red arrows indicating foot process effacement), and lower panels on mitochondria (yellow arrows indicating fragmented mitochondria). F Mitochondrial roundness and foot process width of podocytes after 4-h recovery phase with Mdivi-1 or vehicle treatment or non-injury control. Each dot in the graphs represents the value of each glomerulus. Exact p-value: Control vs Vehicle: *p < 0.0001; Control vs Mdivi-1: **p = 0.0044; Vehicle vs Mdivi-1: #p = 0.0263 for the left graph and Control vs Vehicle: *p < 0.0001; Control vs Mdivi-1: #p = 0.0125; Vehicle vs Mdivi-1: #p = 0.0252 for the right graph. *p < 0.001; **p < 0.01; #p < 0.05. Scale bars: 1 μm in B and E. EM, electron microscopy; IRI, ischemia reperfusion injury.

