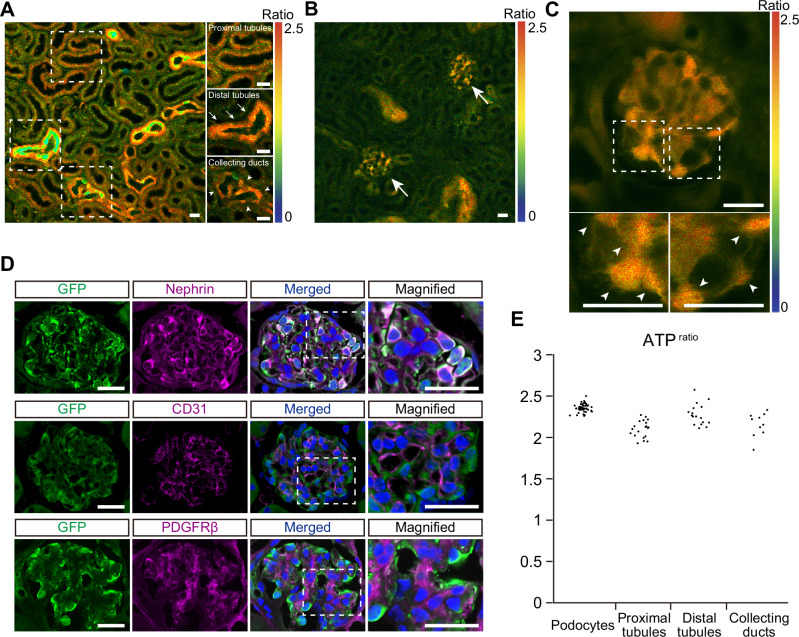
Fig. 2. ATP imaging of the glomeruli and tubules in the living kidneys.
A A representative ATP image of the renal cortex (16 μm deep from the kidney surface). Magnified and laser-adjusted images of the proximal tubules, distal tubules, and collecting ducts are shown in the right panels. B A representative ATP image of the renal cortex containing glomeruli (40 μm deep from the kidney surface). Arrows indicate glomeruli. C A magnified ATP image of a glomerulus. Areas in the dashed boxes are magnified in lower panels. Arrowheads in the lower panels indicate podocytes. D Immunostaining of GO-ATeam2 biosensor and markers in glomerular cells in GO-ATeam2 mice. The GO-ATeam2 biosensor was labelled via GFP immunostaining. The top, middle, and bottom panels show double staining of the biosensor and marker proteins in podocytes (nephrin), endothelial cells (CD31), and mesangial cells (PDGFRβ), respectively. Areas in the dashed boxes are magnified in right panels. E Variation of the ATPratio in podocytes, proximal tubules, distal tubules, and collecting ducts. Each dot represents the average podocyte ATPratio in each glomerulus or tubular ATPratio for each section. The average ATPratio of podocytes, proximal tubules, distal tubules, and collecting ducts was 2.36 ± 0.05, 2.11 ± 0.10, 2.32 ± 0.11, and 2.15 ± 0.10, respectively. Scale bars: 20 μm in (A, B, C, and D).

