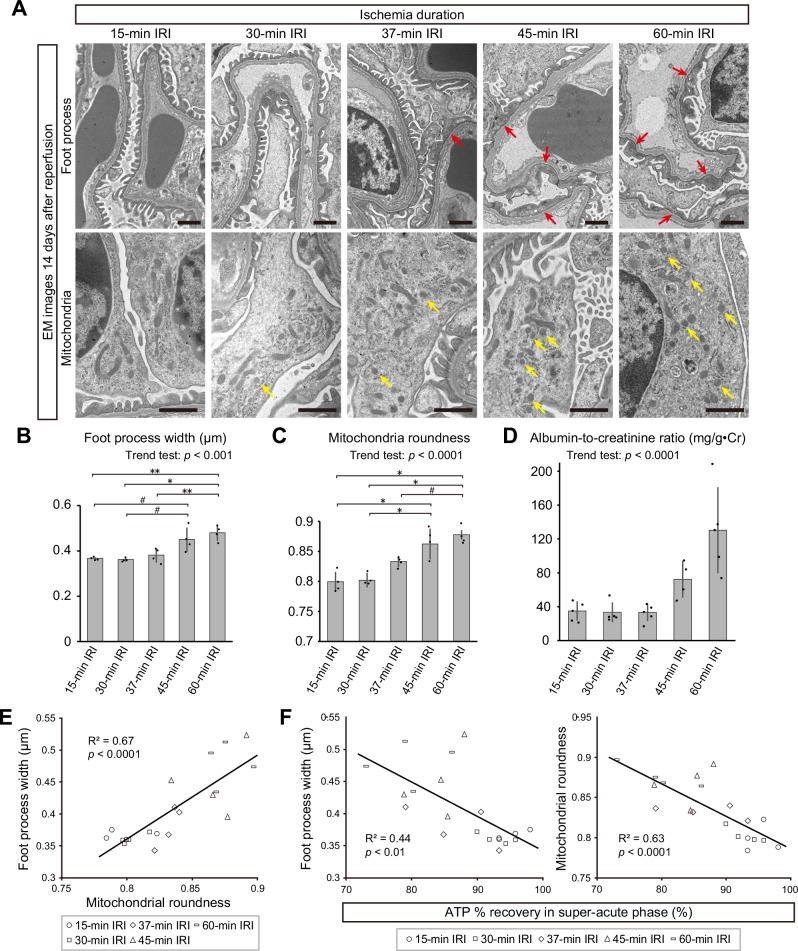
Fig. 7. ATP recovery in the acute phase is inversely correlated with podocyte injury in the chronic phase after IRI.
A Electron microscopic images of podocytes 14 days after various IRI severity levels. Upper and lower panels focus on podocyte foot processes and mitochondria, respectively. Red and yellow arrows indicate foot process effacement and fragmented mitochondria, respectively. Wider views of electron microscopic images are shown in Supplementary Fig. 6A. B Foot process widths 14 days after various IRI severity levels. Exact p-value: 15-min IRI vs 45-min IRI: #p = 0.0163; 15-min IRI vs 60-min IRI: **p = 0.0014; 30-min IRI vs 45-min IRI: #p = 0.0104; 30-min IRI vs 60-min IRI: *p = 0.0009; 37-min IRI vs 60-min IRI: **p = 0.0046. p = 0.0006 for the trend test. C Mitochondrial roundness 14 days after various IRI severity levels. Exact p-value: 15-min IRI vs 45-min IRI: *p = 0.0002; 15-min IRI vs 60-min IRI: *p < 0.0001; 30-min IRI vs 45-min IRI: *p = 0.0004; 30-min IRI vs 60-min IRI: *p = 0.0001; 37-min IRI vs 60-min IRI: #p = 0.0108. p < 0.0001 for the trend test. D Albumin-to-creatinine ratio on day 14–15 after 15-min, 30-min, 37-min, 45-min, and 60-min IRI. Data of 45-min IRI group in Fig. 1H was shown again for comparison. Exact p-value: p < 0.0001. E Correlation between the foot process width and mitochondrial roundness 14 days after IRI. Exact p-value: p < 0.0001. F Correlation between the foot process width or mitochondrial roundness 14 days after IRI and ATP % recovery in podocytes in the super-acute phase of IRI. Exact p-value: Foot process width-ATP % recovery: p = 0.0016; Mitochondrial roundness-ATP % recovery: p < 0.0001. *p < 0.001; **p < 0.01; #p < 0.05. Scale bars: 1 μm in A. IRI, ischemia reperfusion injury; EM, electron microscopy.

