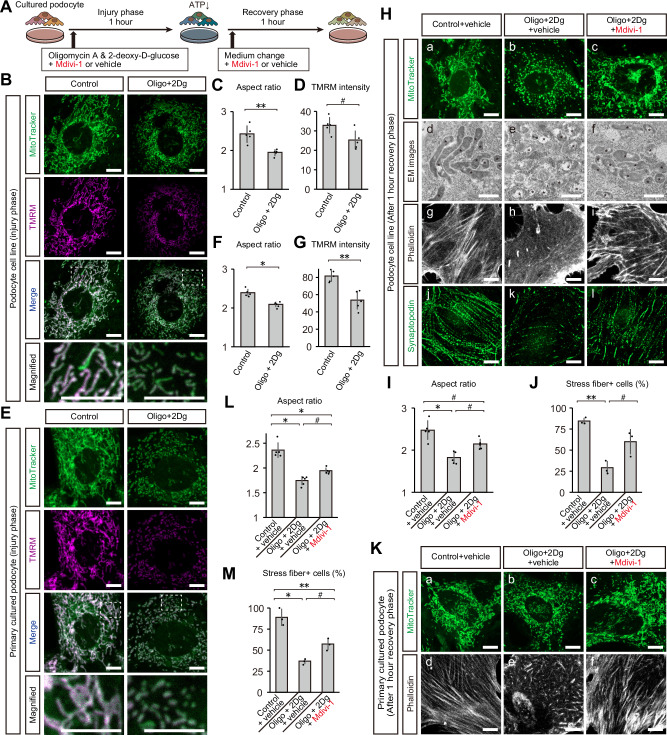
Fig. 8. Suppression of mitochondrial fission ameliorates podocyte cytoskeleton disarrangement in cultured podocytes.
A Graphical representation of the experimental design for in vitro IRI. B Confocal images of MitoTracker and TMRM staining in podocyte cell line after the injury phase. Bottom panels show magnified images of dashed boxes in merged images. C Aspect ratios of mitochondria of podocyte cell line after injury phase. D TMRM intensity of mitochondria of podocyte cell line after injury phase. E Confocal images of MitoTracker and TMRM staining in primary cultured podocytes after the injury phase. Bottom panels show magnified images of dashed boxes in merged images. F Aspect ratios of mitochondria of primary cultured podocytes after injury phase. G TMRM intensity of mitochondria of primary cultured podocytes after injury phase. H TEM and confocal images of podocyte cell line after the recovery phase: a–c, MitoTracker staining; d–f, TEM images focusing on mitochondria (asterisks); g–i, actin cytoskeleton visualized by phalloidin labelling; j–l, synaptopodin immunostaining. I Aspect ratios of mitochondria of podocyte cell line after recovery phase. J Percentages of stress fiber-positive cells in podocyte cell line after the recovery phase. K Confocal images of primary cultured podocytes after the recovery phase: a–c, MitoTracker staining; d–f, actin cytoskeleton visualized by phalloidin labelling. L Aspect ratios of mitochondria of primary cultured podocytes after recovery phase. M Percentages of stress fiber-positive cells in primary cultured podocytes after the recovery phase. Exact p values for (C), (D), (F), (G), (I), (J), (L), and (M) are shown in Supplementary Table 1, 2. *p < 0.001; **p < 0.01; #p < 0.05. Scale bars: 1 μm in d–f for H; 10 μm in (B, E, a–c and g–l for H, and K). EM, electron microscopy; Oligo, oligomycin A; 2-Dg, 2-deoxy-D-glucose; IRI, ischemia reperfusion injury.

