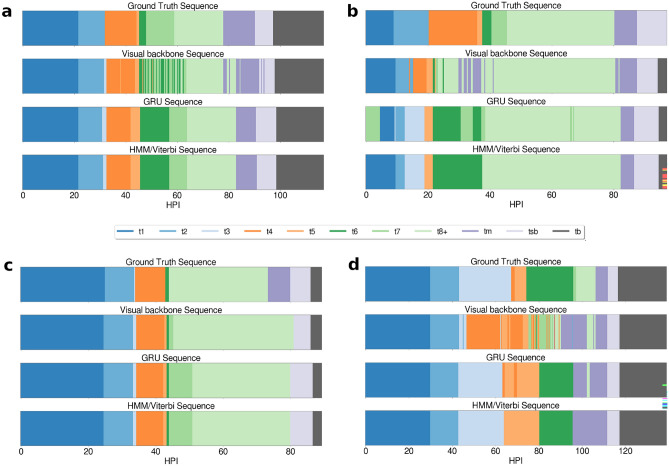
Figure 4.
Visualization of the sequence of events on 4 videos. The x-axis represents the time in hpi, and each color corresponds to a biological event annotated or detected for this hpi. The first row of color sequence displays the ground truth as annotated by the embryologists. The second row displays the detections of the visual backbone, the third row presents the detections of the sequence model (GRU) using the output feature of the and the fourth row shows the final prediction of the BEE model after smoothing with the HMM component.

