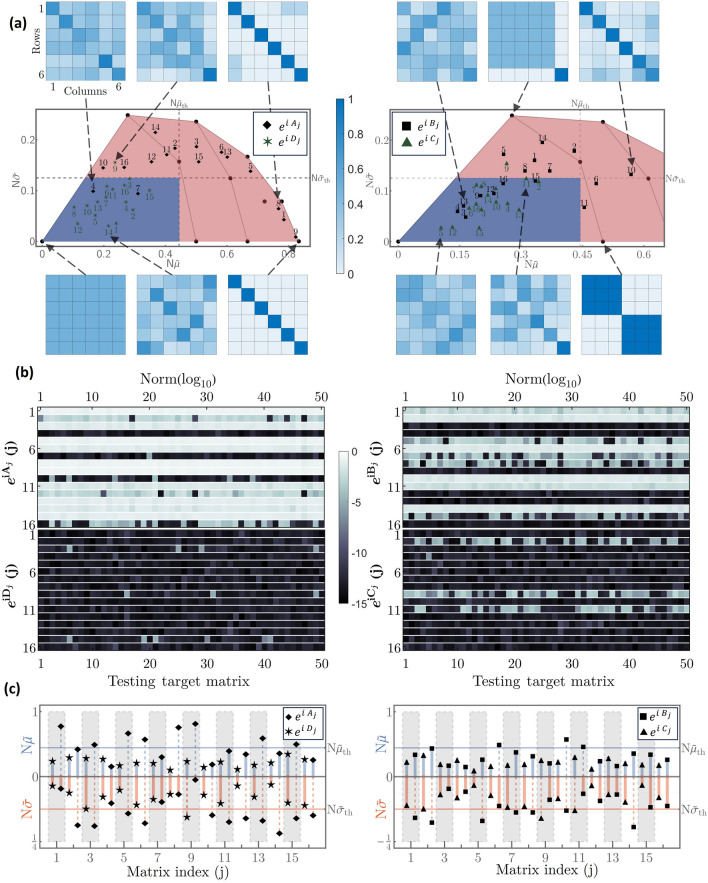
Figure 3.
Density estimation and performance test. (a) Points associated with density criterion for the set of unitary matrices (left column) and (right column). The shaded blue area denotes the Goldilocks region where universality is expected for . In turn, the blue heat maps denote the modulus of some particular choices of the unitary matrices, with . (b) Error norm (log) L in (2) for each unitary matrix under consideration with fifty testing targets per matrix. (c) Mean and standard deviation and , respectively, related to the density estimation for each unitary matrix in (a). The horizontal blue and red lines denote the universality threshold for and , respectively.

