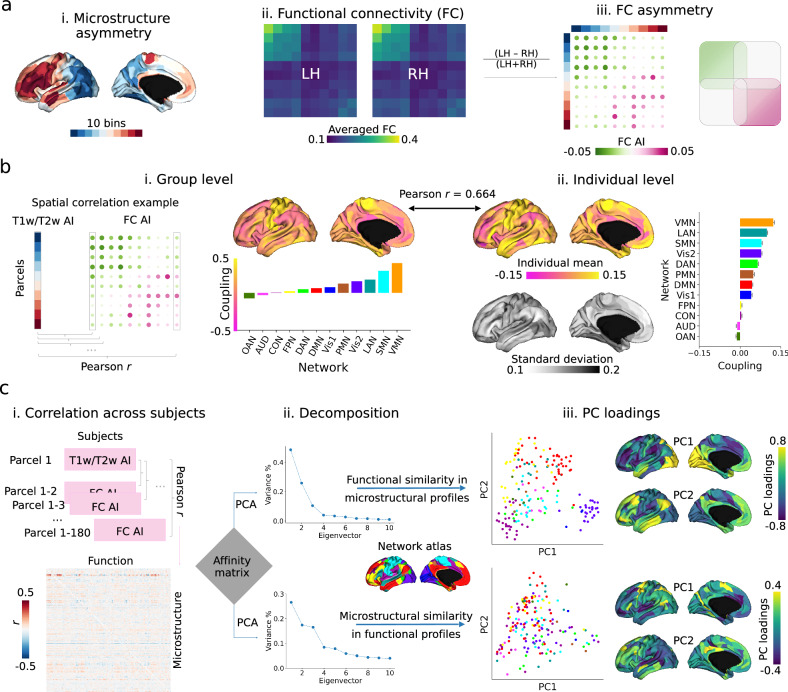
Fig. 3. Microstructure-function relationship in asymmetry using HCP T1w/T2w and resting state functional images (N = 1004).
a–i 10 bins (18 parcels per bin) categorized from Fig. 2b mean AI map (T1w/T2w). a–ii. Group-level resting state functional connectivity (FC) matrix averaged by bins. a-iii. FC asymmetry calculated by (LH - RH)/(LH + RH) sorted by bins. Purple-red and green indicate left- and right-ward asymmetry. Scatters are colored by functional networks. b Region-wise microstructure-function coupling was calculated by Pearson correlation coefficient between 180 parcels of T1w/T2w and FC AI per column. Left panel shows coupling between mean maps at the group level (i) and the right panel shows mean and standard deviation of coupling (ii). c Individual covariation between microstructure and function. Matrix in (i) represents the Pearson r between parcel T1w/T2w AI and FC AI across subjects. Then, the parcel-wise affinity matrix was computed and principal component analysis (PCA) was employed to decompose the matrix to detect the inter-region similarity axes (ii). Upper and lower panels are microstructural and functional decomposition (iii). The first two eigenvectors and eigenvalues (PC loadings) are plotted with similar colors in ‘viridis’ indicating similar profiles between regions. Atlas-defined networks include primary visual (Vis1), secondary visual (Vis2), somatomotor (SMN), cingulo-opercular (CON), dorsal attention (DAN), language (LAN), frontoparietal (FPN), auditory network (AUD), default mode (DMN), posterior multimodal (PMN), ventral multimodal (VMN), orbito-affective (OAN).

