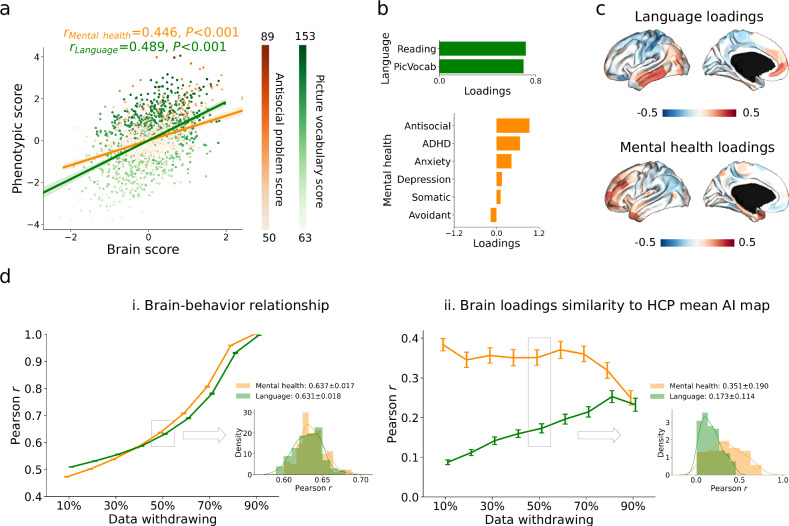
Fig. 4. Canonical correlation analysis (CCA) between microstructural asymmetry features and language/mental health in HCP.
a Correlation between latent dimensions of the brain and phenotype. Orange and green indicate mental health and language, where the latent dimensions explain antisocial behavior and picture vocabulary scores most. b Phenotypic loadings of the first latent dimension for language and mental health. c Brain loadings of the first latent dimension for language and mental health. d Resampling data to test the performance of CCA. We withdrew data from 10% to 90% by pseudo-randomization using twin classes and resampled 100 times. Mean and standard error bars were shown in the charts. Data withdrawal of 50% was selected to show the distribution across the 100 samples and other percentages see Supplementary Fig. S4. PicVocab: picture vocabulary; ADHD: attention deficit/hyperactivity disorder.

