Fig. 6.
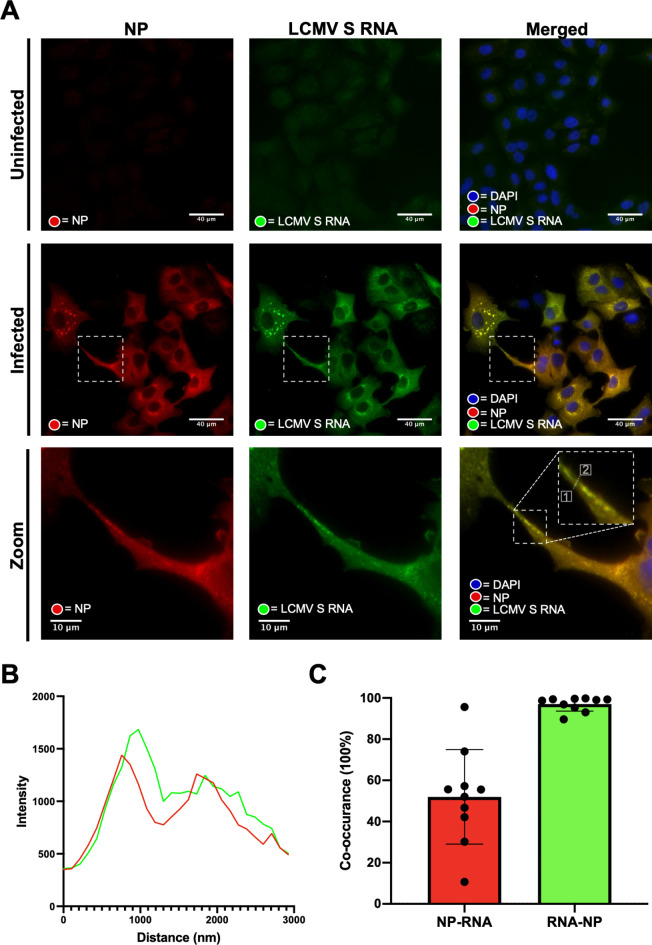
LCMV vRNA is present alongside NP in TNT-like connections. (A) At 24 hpi rLCMV infected A549 cells at an MOI of 1 were fixed and then stained for NP (red). Subsequently, coverslips were hybridised overnight with 48 specific FISH probes designed to hybridize with LCMV S vRNA (green). Widefield microscopy was then utilised to visualise NP and S vRNA within TNT-cell connections. Cell nuclei were DAPI stained. Uninfected cells and infected cells are shown. A zoomed-in region of interest (white box in the central row) is shown on the bottom row. (B) Line scan analysis of the region of interest in the zoomed merged image (dashed line in the bottom right panel of (A)) revealed peaks in intensity of NP and S vRNA were similar. (C) Co-occurrence analysis using the Manders coefficient method was performed for 10 TNT-like connections. The percentage of LCMV NP to S vRNA (Red) and S vRNA to LCMV NP (green) is shown, and individual images plotted.

