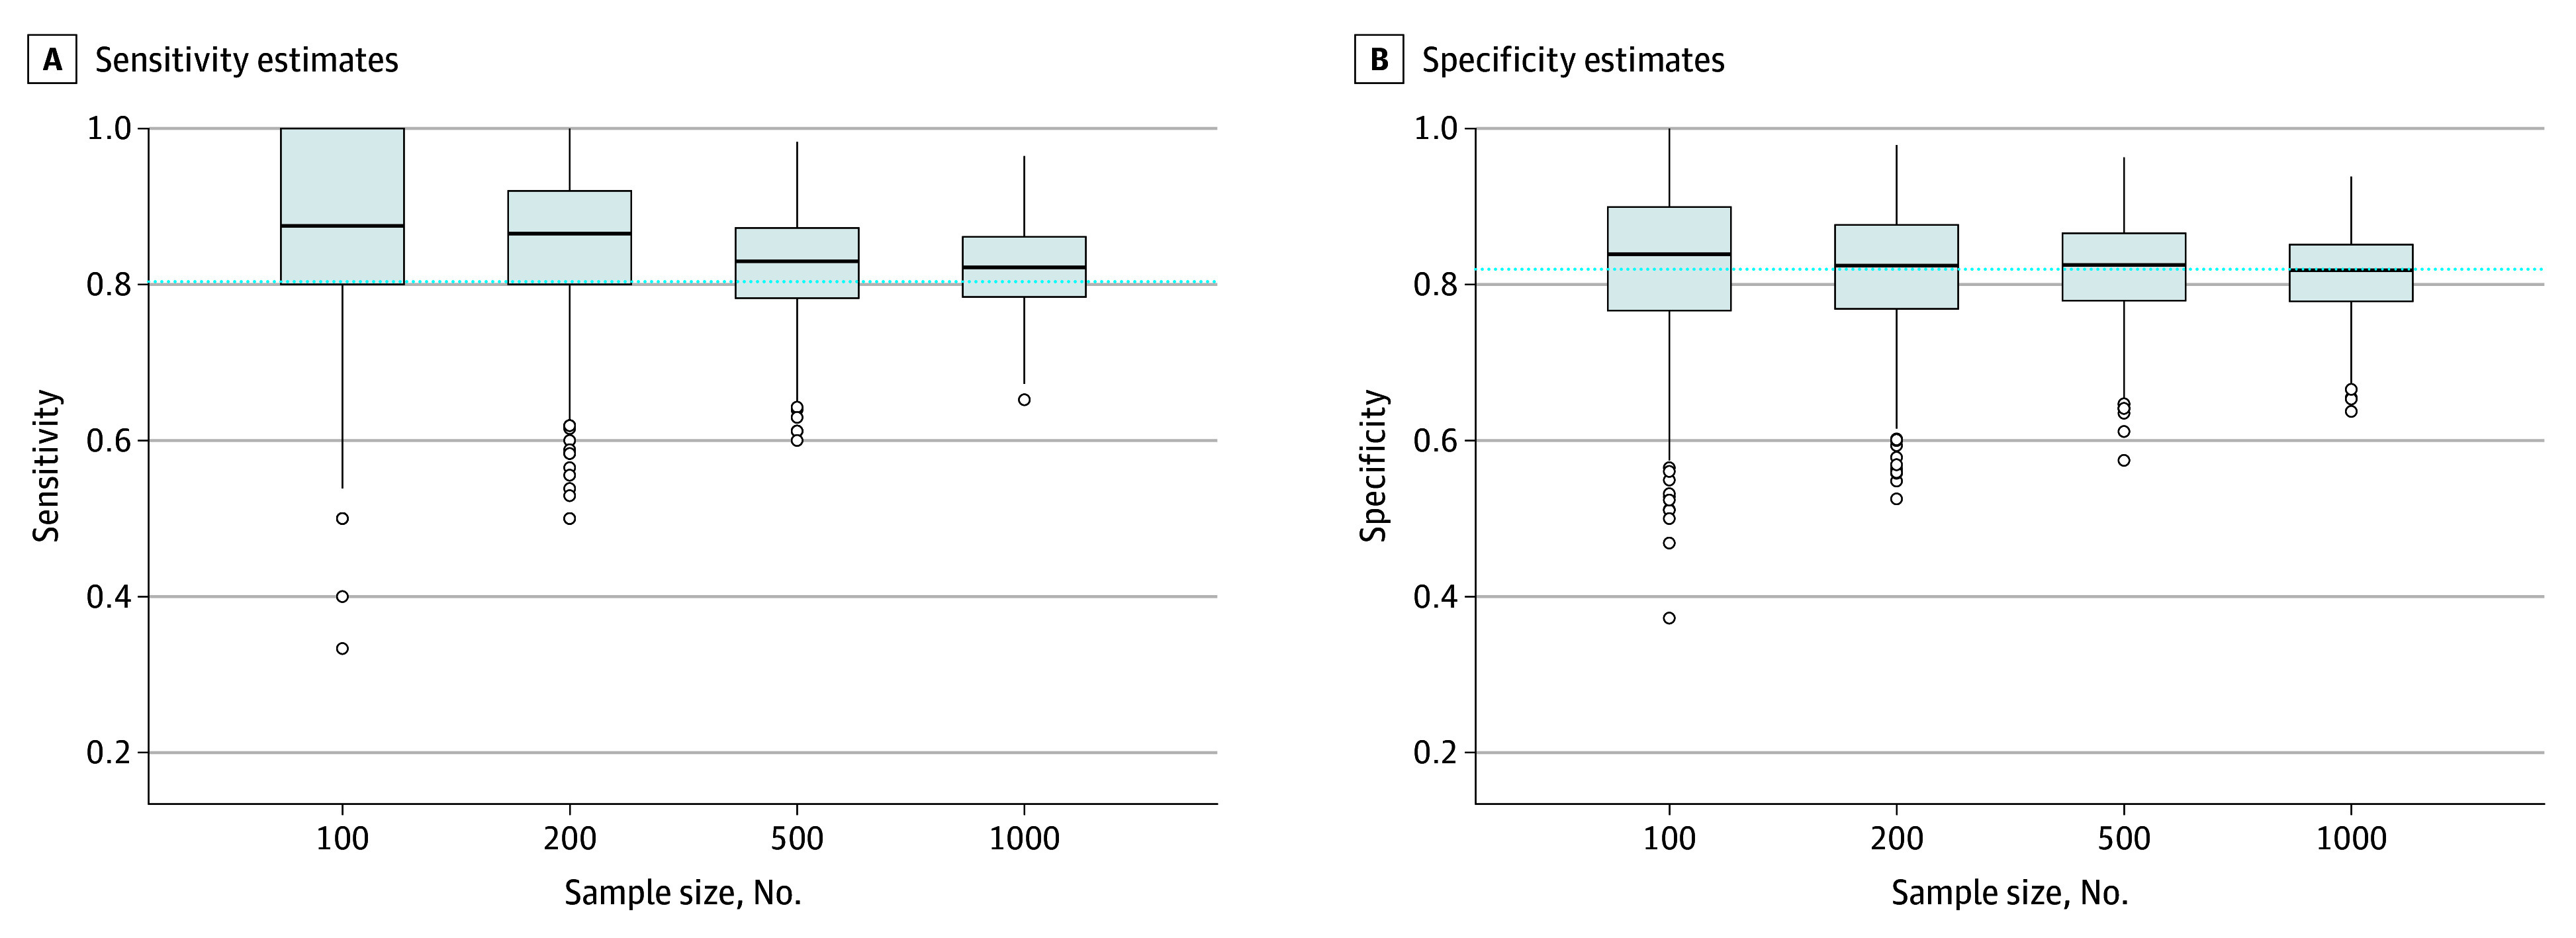
Figure 2. Variability in Accuracy Estimates of the Optimal Cutoff Scores in 1000 Resampled Studies of 100, 200, 500, and 1000 Participants vs Accuracy Values for a Cutoff of 8 or Higher in the Population.

Edges of boxes represent the 25th and 75th percentiles; horizontal line inside boxes represents the median; dashed horizontal line represents the accuracy of the true population-level optimal cutoff score in the full Patient Health Questionnaire-9 individual participant data meta-analysis dataset (cutoff score ≥8; sensitivity = 80.4%, specificity = 82.0%); and dots represent outliers.
