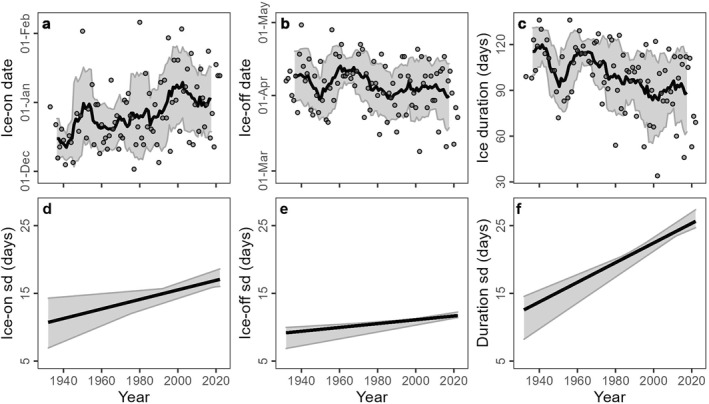
Figure 2.

Ice phenology in Mohonk Lake from 1932 to 2022 for (a) ice‐on, (b) ice‐off, and (c) ice duration. For each figure, the 9‐year simple moving average is presented as the dark line, and the Bollinger Band (±10‐year rolling standard deviation) is the shaded area presented at the median year for each 10‐year window. Standard deviations for mean trends (slope and intercept) across all sequential windows (4–30 years)for (d) ice‐on, (e) ice‐off, and (f) ice duration with shaded areas representing minimum to 95% possible trend line fits for each year.
