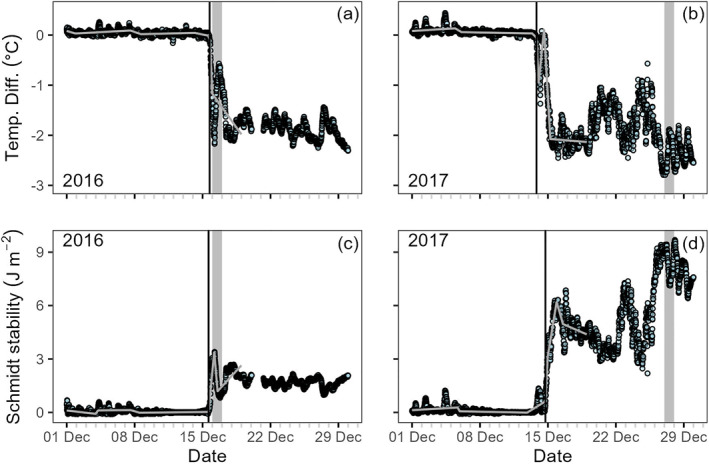
Figure 7.

High frequency (15 min) metrics of inverse stratification including temperature difference between the upper (0 m) and lowest (9 m) temperature sensors in December (a) 2016 and (b) 2017 and the Schmidt stability in December (c) 2016 and (d) 2017. The vertical black bar indicates the steepest line of change for all metrics as an indicator of statistically identifiable ice‐on date and time to the nearest 15 min. The gray bar indicates the day (full 24‐hr period) identified from visual assessment as the first day of the winter with 100% ice cover. The gray lines are the best fit segmented regressions.
