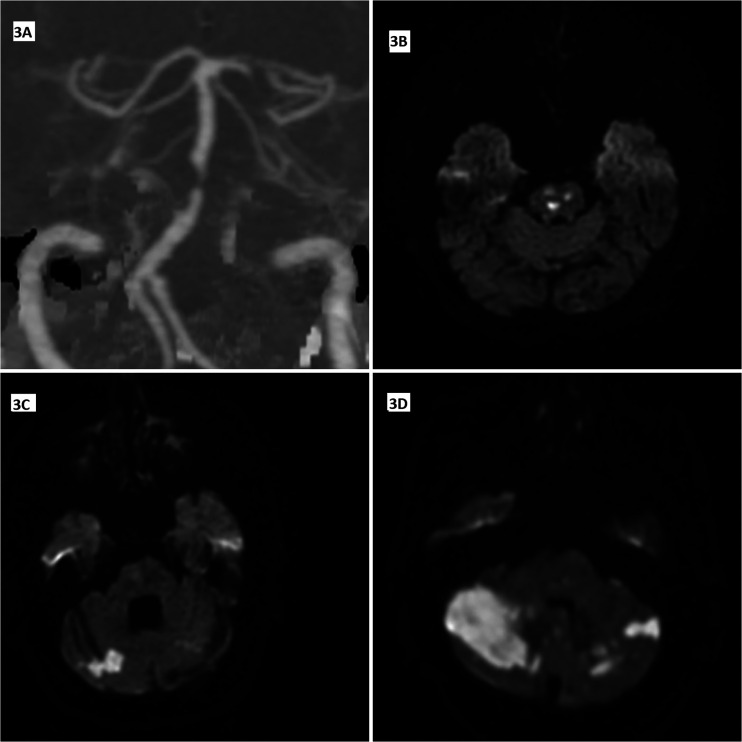
Figure 3.
Computed tomography angiography (CTA) maximum intensity projection image (3A) from a patient with pre-occlusive stenosis in the basilar artery, DWI images from different patients (3B–D); multiple acute lacunes in pons due to perforating artery ischemia (3B); acute hemodynamic infarcts in the right cerebellar hemisphere and late subacute hemodynamic infarcts in the left cerebellar hemisphere (3C), scattered infarcts developed due to the artery-artery embolic process in both cerebellar hemispheres (3D).

