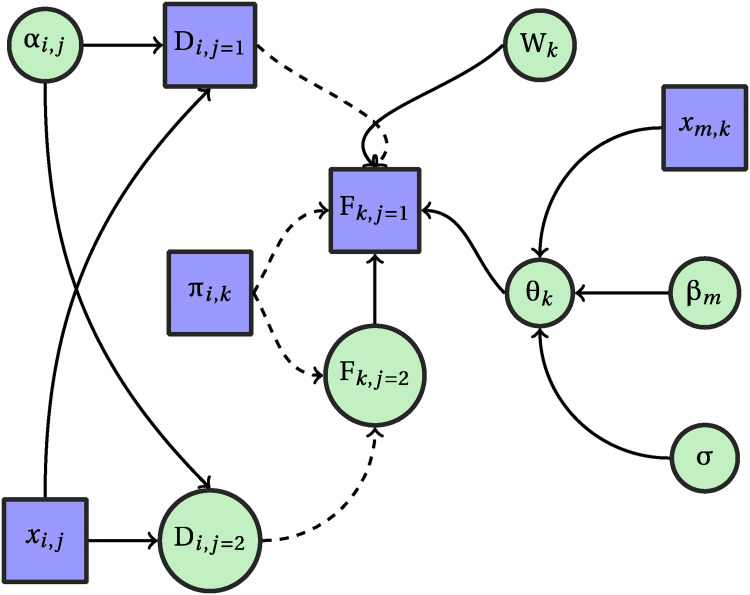
Figure 1.
Directed acyclic graph illustrating relationships between data and parameters in the multi-level Bayesian model. Squares are data and circles are parameters. Solid lines are stochastic relationships and dashed lines are deterministic. Note that is transformed data (dashed lines) that is also used as the response variable for a stochastic regression model (solid lines).

