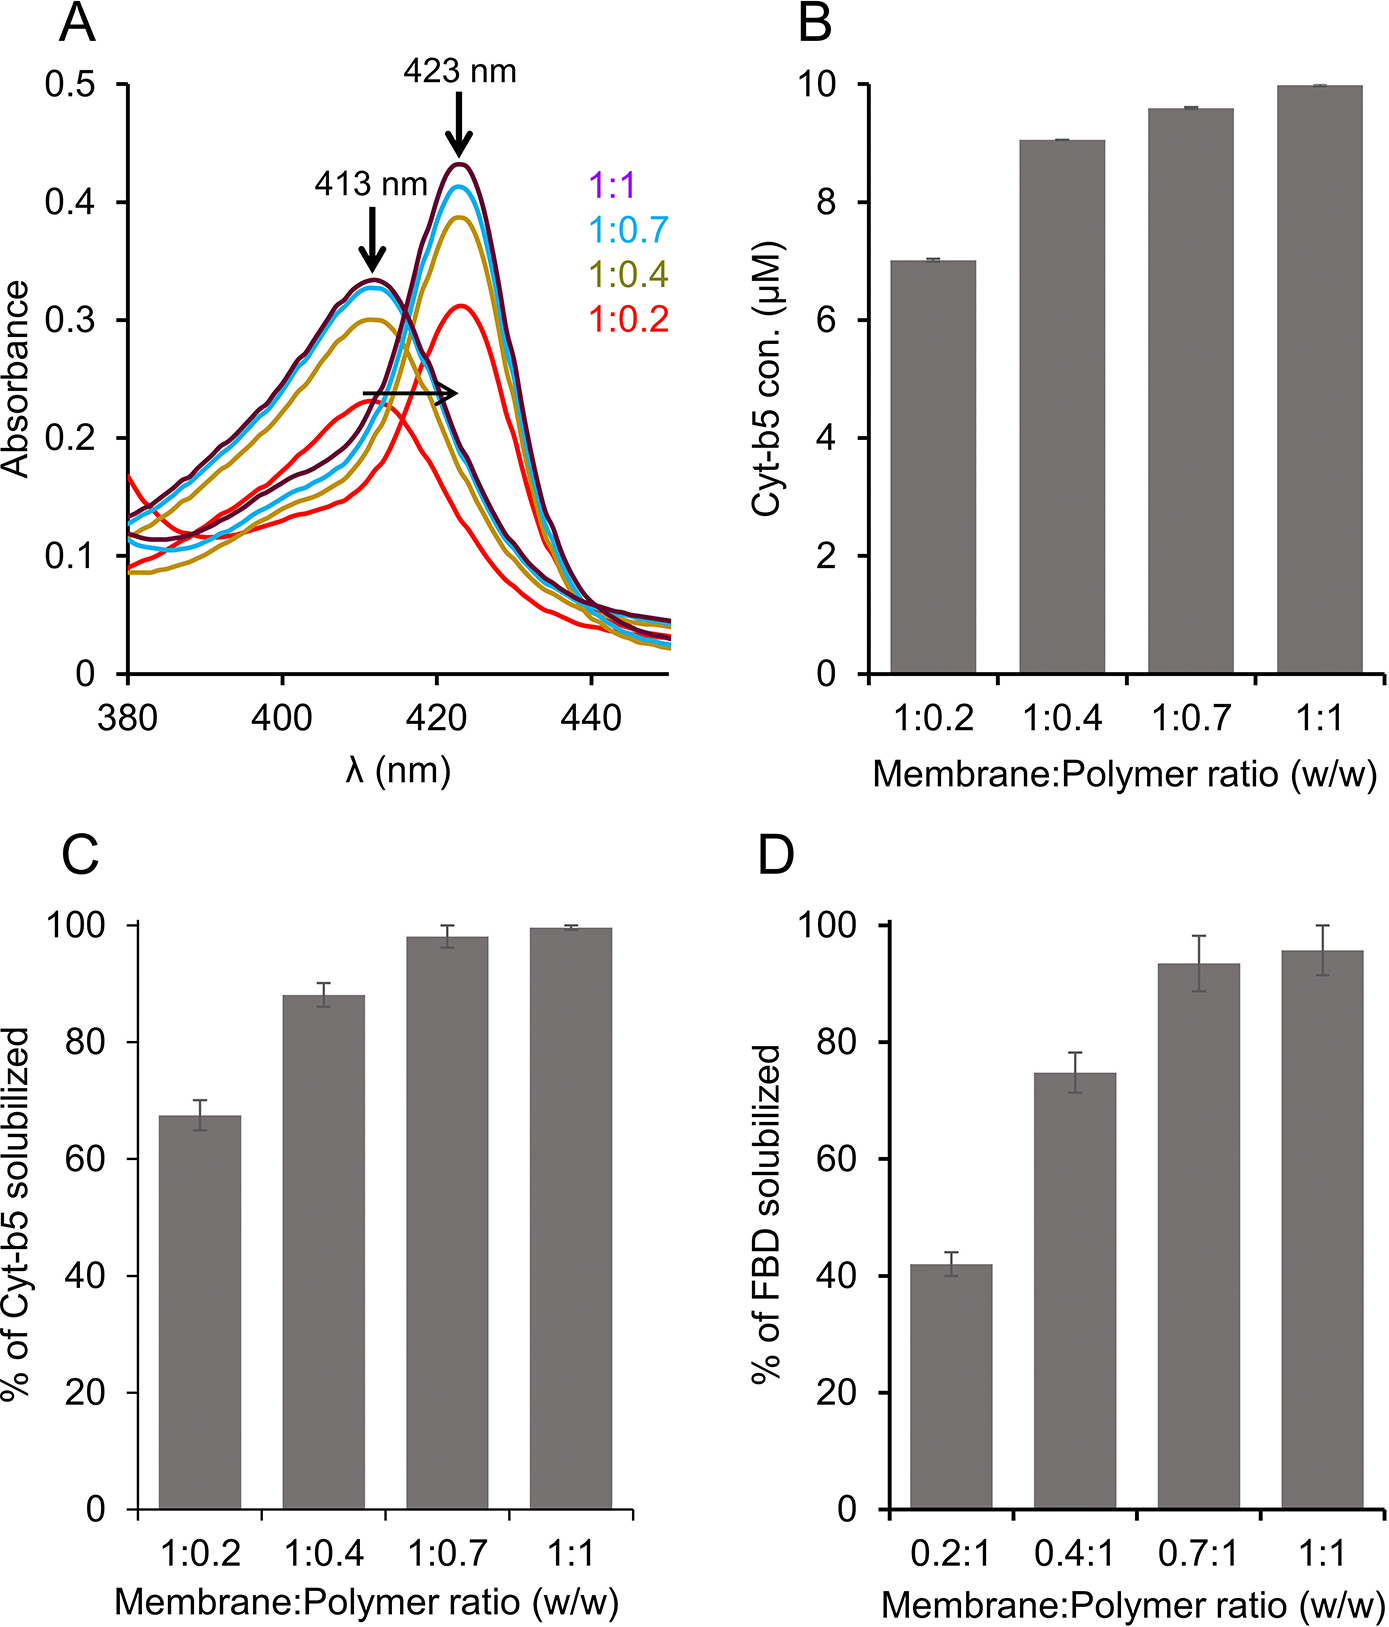
Figure 2.

Solubilization of Cyt-b5 or FBD-enriched E. coli membranes in the presence of different concentrations of pentyl-inulin. The quantity of membranes was kept constant (250 mg/mL), and the amount of polymer added was varied to obtain four different membrane:polymer w/w ratios, 0.2:1, 0.4:1, 0.7:1, and 1:1. The membranes were solubilized at 4 °C overnight. (A) Absorbance spectra were measured to determine the protein concentration in the polymer-solubilized membrane samples. The horizontal arrow indicates the disappearance of a peak at 413 nm (oxidized form) and the appearance of a new peak at 423 nm (sodium dithionite-reduced form). The increase in the absorbance peak intensity is shown with an upside arrow, and the membrane:polymer ratios (w/w) are indicated. The data shown are from one of the technical replicates of solubilization experiments. (B-D) Bar plots depicting (B) the concentration of Cyt-b5 determined from (A), the percentage of (C) Cyt-b5 and (D) FBD protein bands (from SDSPAGE gels) quantified by ImageJ.
