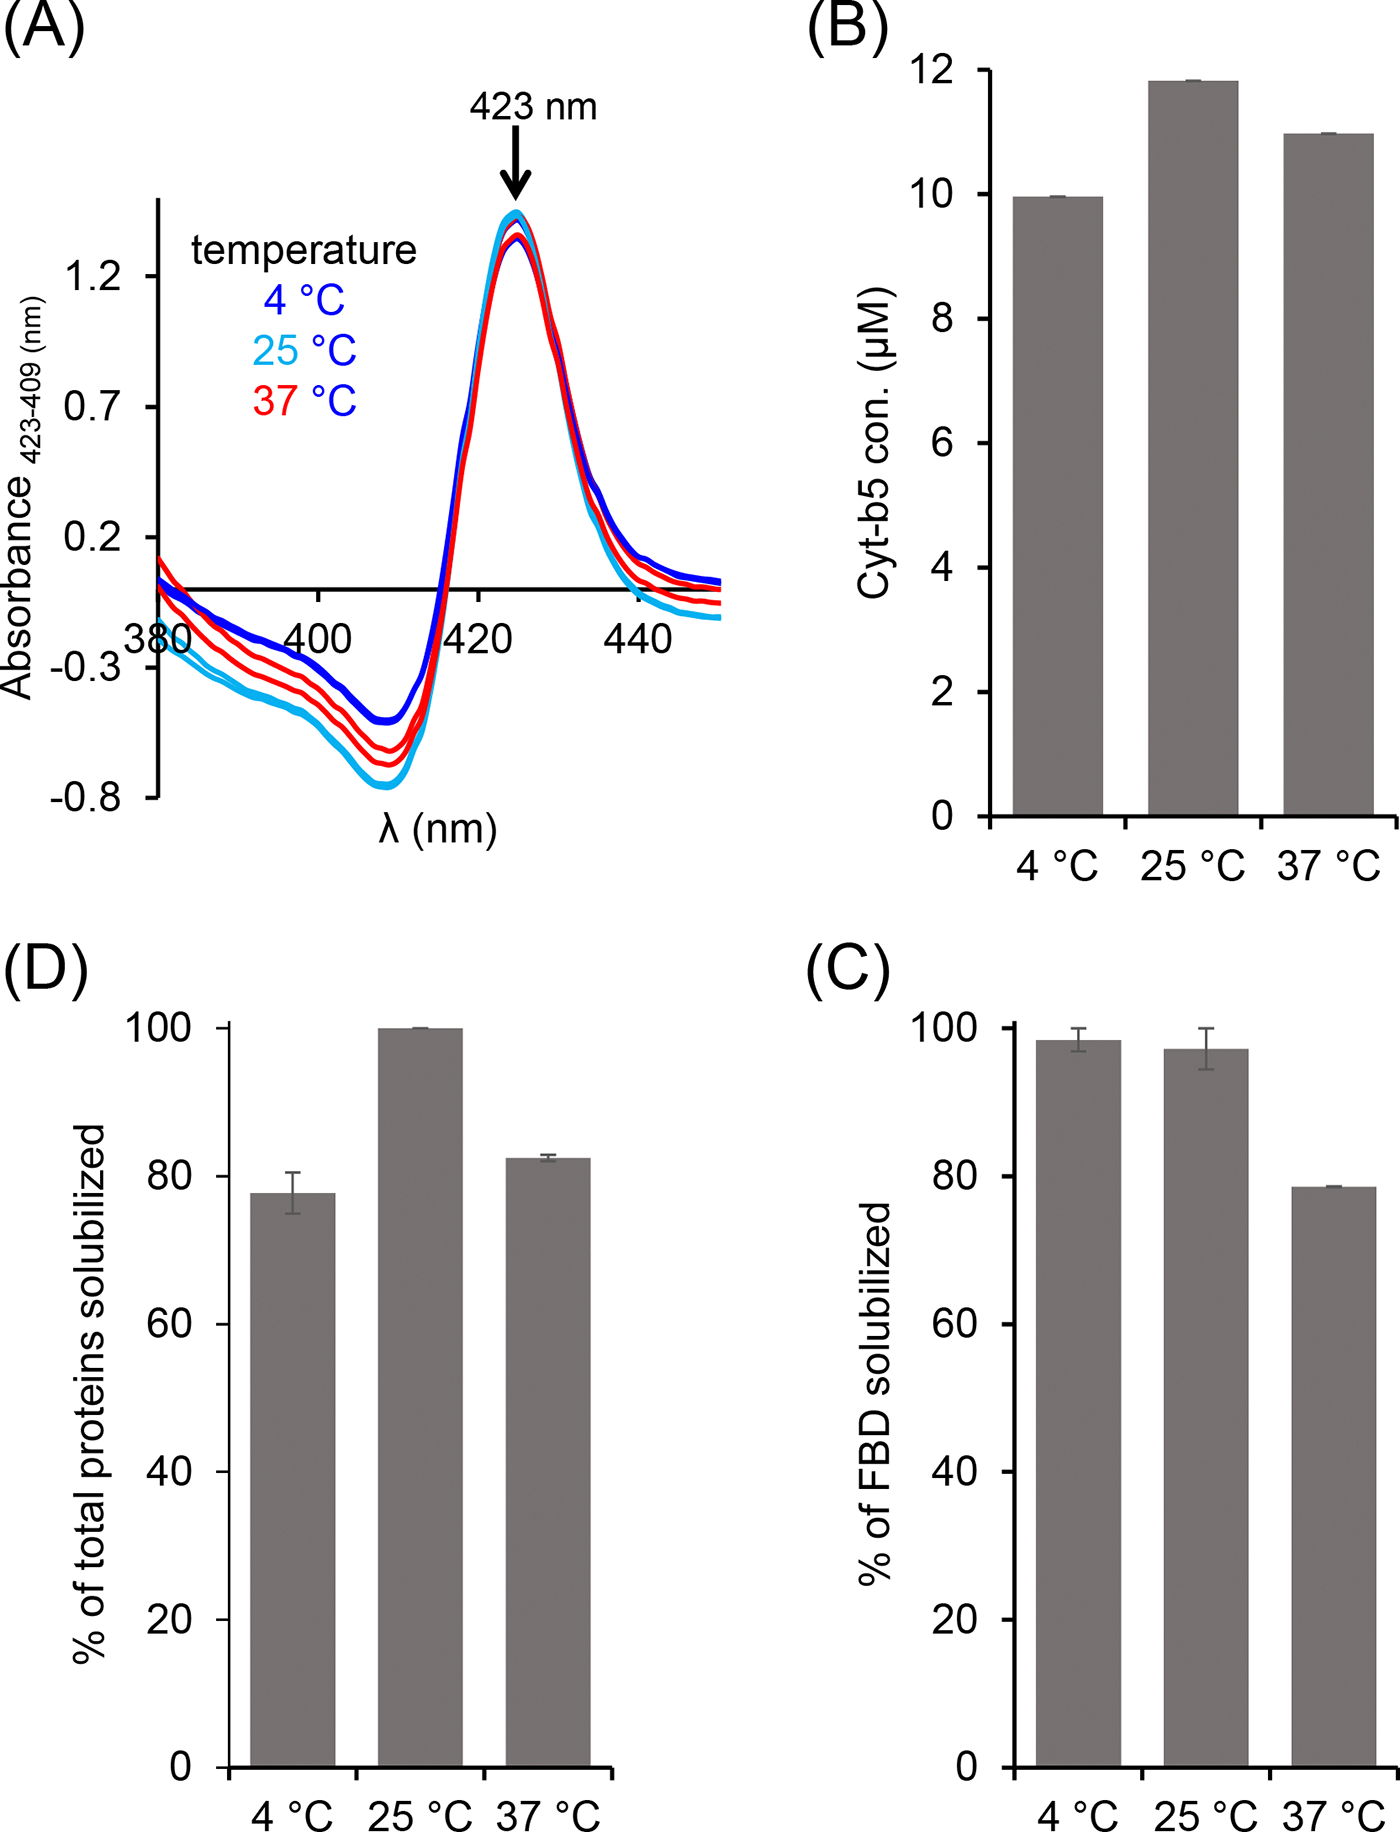
Figure 3.

Variable-temperature solubilization of Cyt-b5 and FBD-enriched E. coli membranes. (A, B) Cyt-b5, (C) FBD and (D) total membrane proteins analyzed from absorbance spectra and SDS-PAGE. The absorbance difference spectra were obtained by subtracting the absorbance spectra of oxidized Cyt-b5 from that of reduced Cyt-b5 (A). The down arrow indicates an increase in the absorbance observed at 423 nm. The samples were prepared using 1:1 [w/w] membrane:polymer ratio (25 mg/mL each). All the samples were prepared on ice before incubating them at different temperatures 4, 25, and 37 °C. The FBD samples were analyzed by SDS-PAGE. Image Lab software was used to quantify the membrane protein band intensities. The plots were generated from two independent experiments, and error bars indicate the difference in the extent of solubilization measured from them. The data were normalized to the sample that showed the maximum solubilization at each solubilization experiment.
