Figure 2.

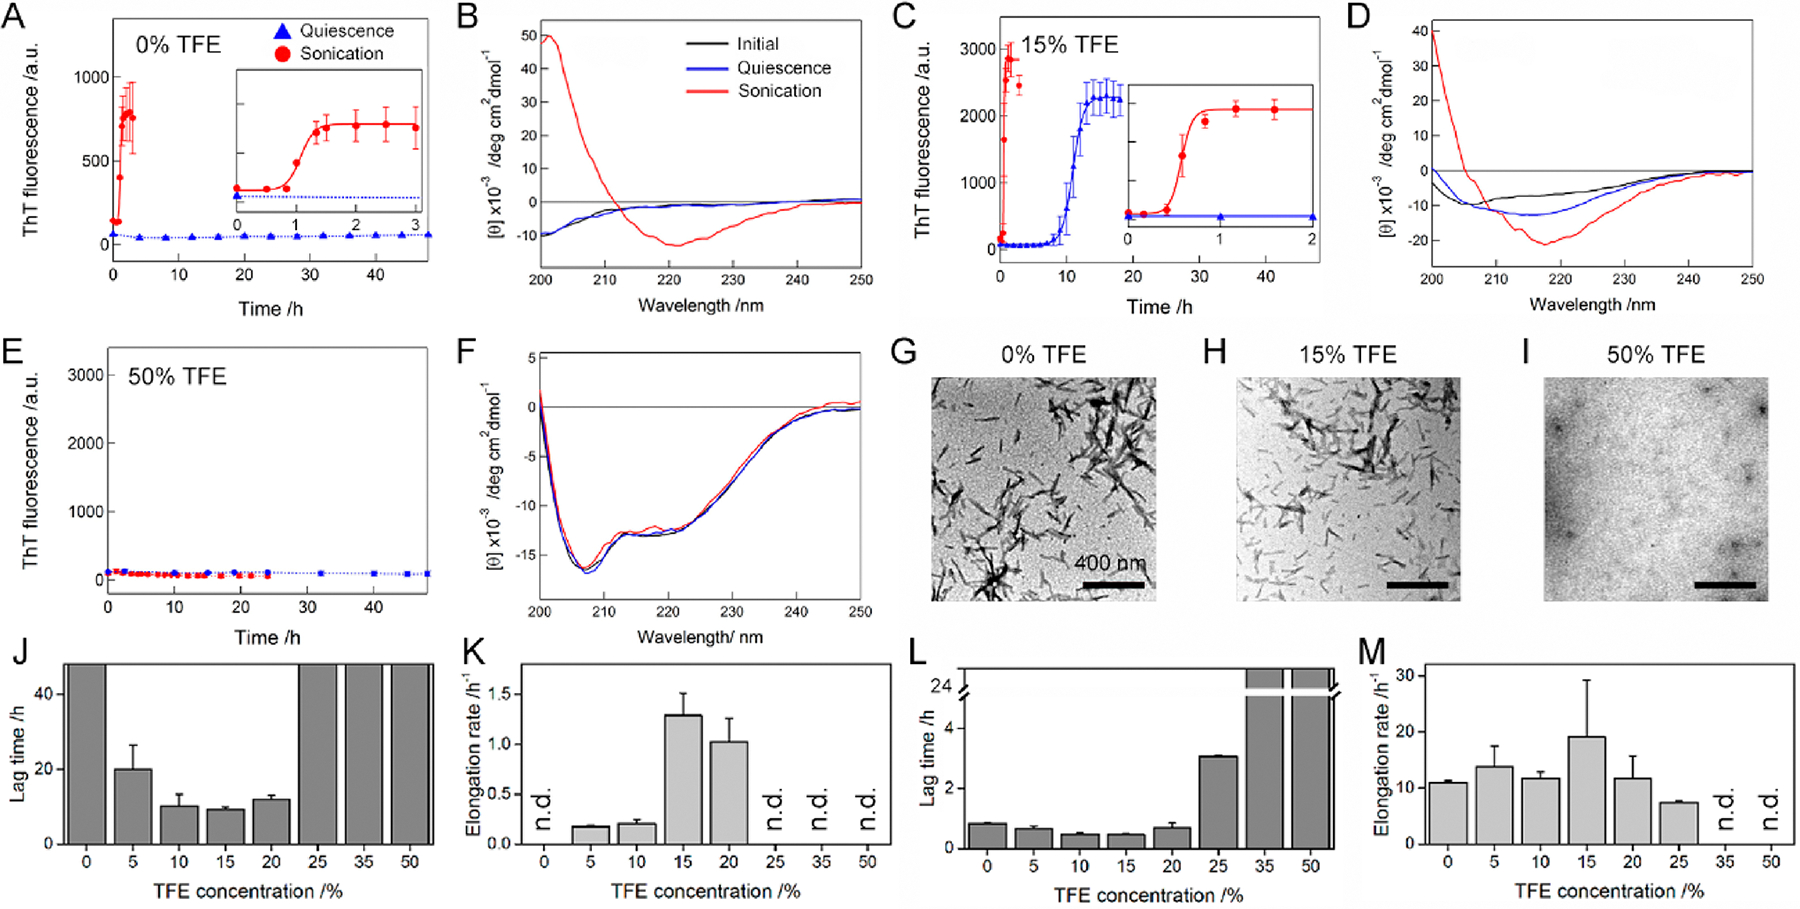
TFE concentration-dependent amyloid formation of Aβ1–40 under quiescent and stimulated conditions. (A–I) The aggregation of Aβ1–40 was traced by (A, C, and E) ThT fluorescence, (B, D, and F) far-UV CD, and (G, H, and I) TEM at various TFE concentrations. The ThT intensities of the Aβ1–40 solution without agitation (blue triangle) and with sonication (red circle) were plotted as a function of time. Solid lines represent the fit curves of the kinetics of Aβ1–40 amyloid fibrillation. Dotted lines were drawn as an eye-guide only. Inserts in A and C are the magnified profiles of rapid kinetics of Aβ1–40 fibrillation with sonication. Far-UV CD spectra of Aβ1–40 were recorded after incubation without agitation (blue line) and with sonication (red line). The CD spectra of Aβ1–40 measured soon after sample preparation are shown as a comparison (black line). TEM images were taken from Aβ1–40 samples after incubation with sonication. The concentration of TFE used was displayed above the TEM images. Scale bar = 400 nm. (J–M) The lag time (J and L) and elongation rate constant (K and M) of Aβ1–40 fibrillation in TFE/water mixtures without agitation (J and K) and with sonication (L and M) are displayed. “n.d.” denotes the TFE concentrations at which no enhancement in the ThT fluorescence intensity was observed. Error bars indicate the standard deviation of three independent measurements.
