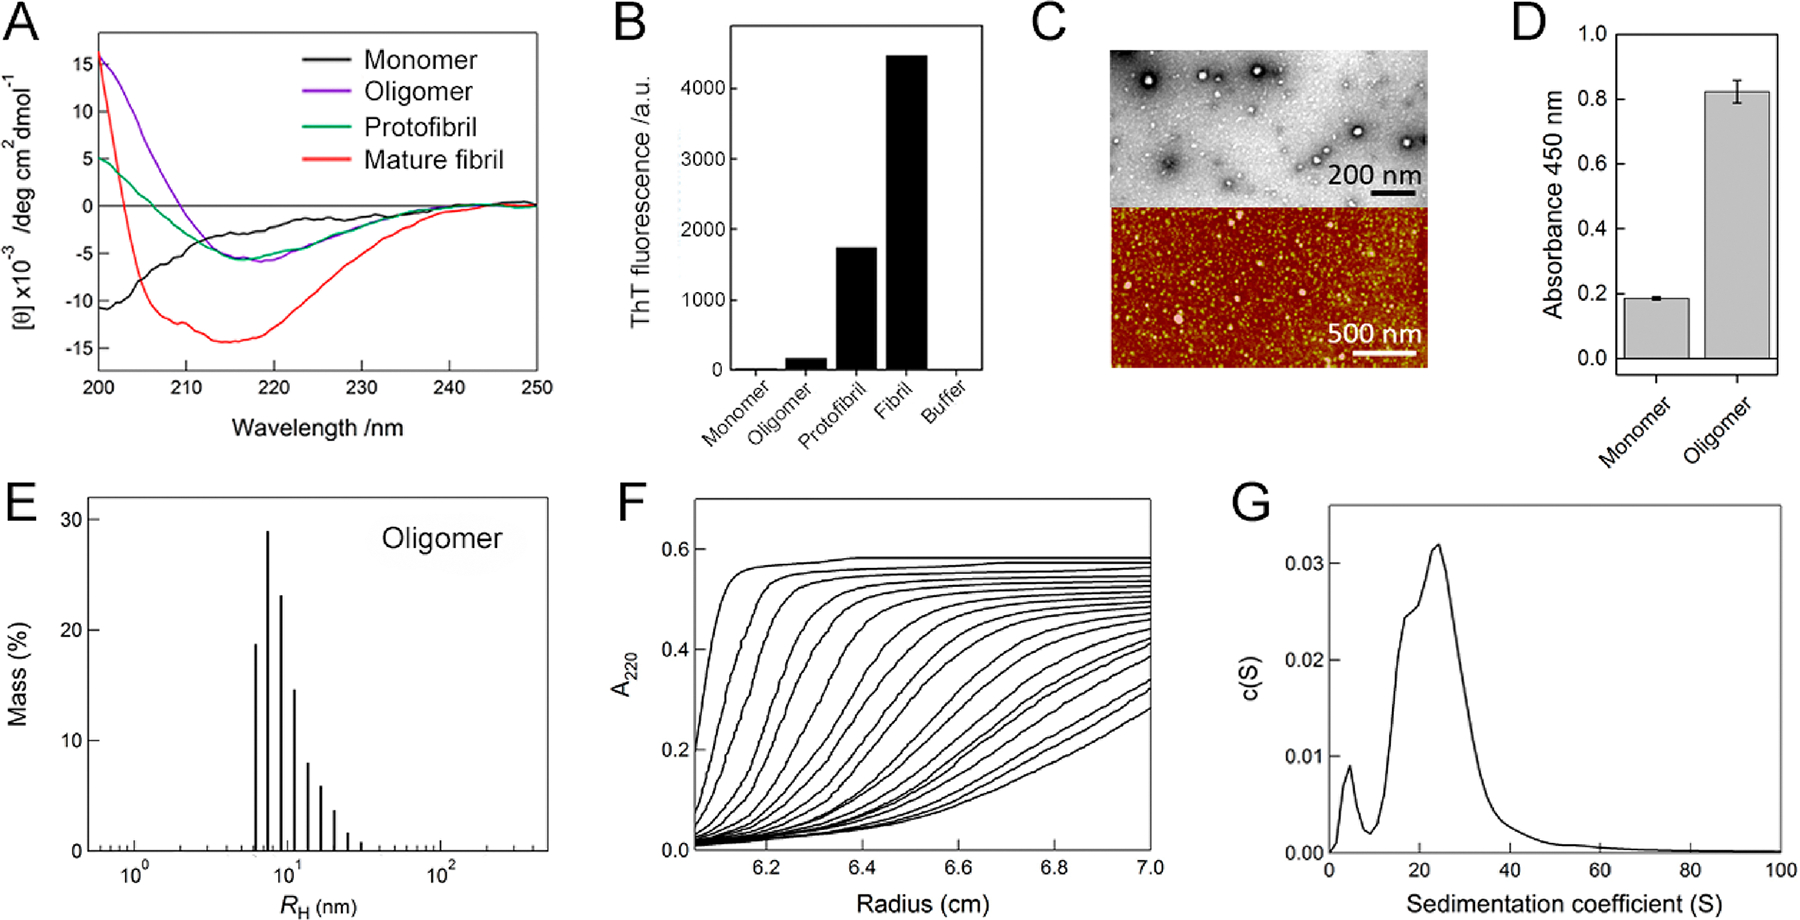
Figure 4.

Characterization of Aβ1–40 oligomers. (A) Far-UV CD spectra of Aβ1–40 monomers (black line), oligomers (magenta line), protofibrils (green line), and mature amyloid fibrils (red line). (B) Fluorescence intensities of ThT at 485 nm for Aβ1–40 monomers, oligomers, protofibrils, mature amyloid fibrils, and buffer alone. (C) TEM (upper panel) and AFM (lower panel) images of Aβ1–40 oligomers. The scale bars of TEM and AFM represent 200 and 500 nm, respectively. (D) Detection of Aβ1–40 oligomers using the sandwich ELISA based on absorbance at 450 nm. Absorbance of monomers was recorded for the control. (E) Distribution of the hydrodynamic radii of Aβ1–40 oligomers, obtained by dynamic light scattering measurements. (F) Sedimentation velocity profiles of Aβ1–40 oligomers optically detected at 220 nm. Fitted sedimentation boundaries measured at an interval of 15 min are shown. (G) Distribution of the sedimentation coefficient of Aβ1–40 oligomers derived from the sedimentation velocity data in F.
