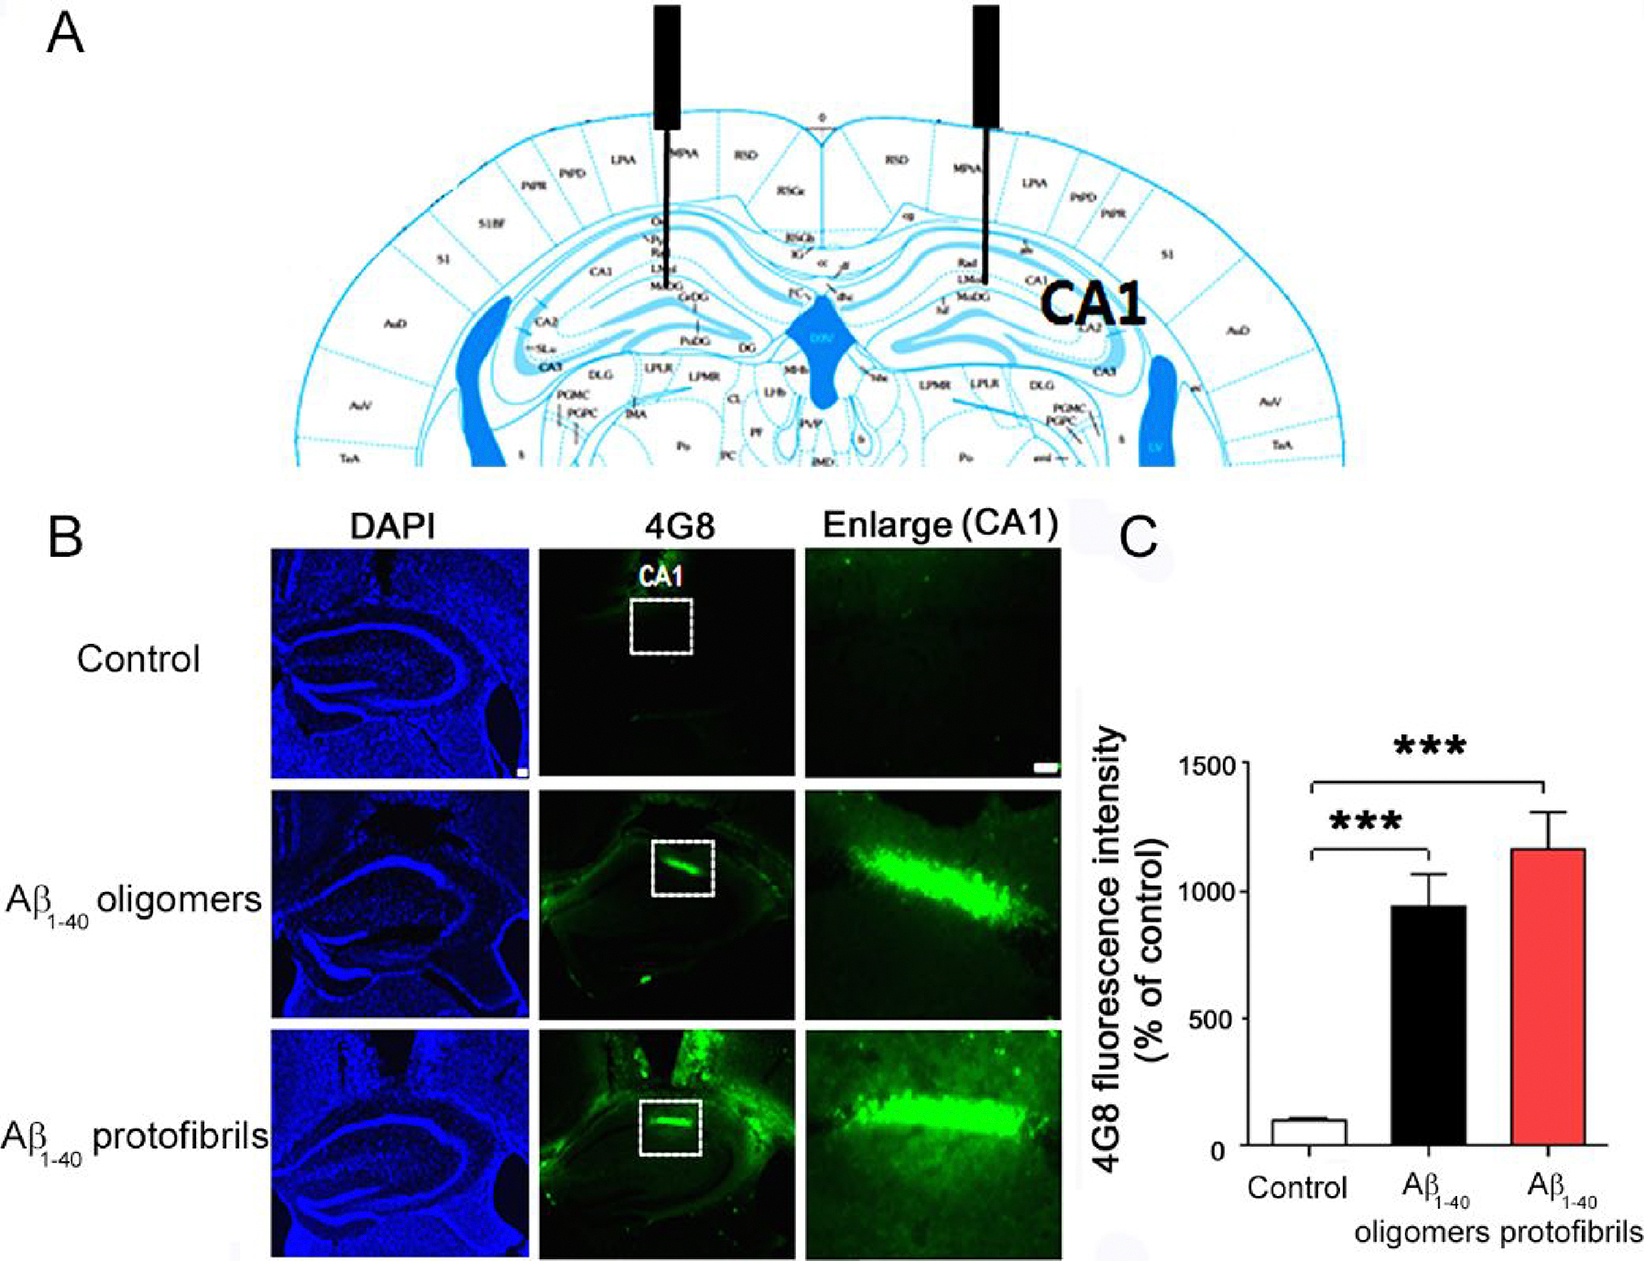
Figure 7.

Immunohistochemical examination of the deposition of amyloid plaques in the hippocampal CA1 region. (A) Illustration of the cross section of the mouse brain to show the injection site (CA1). (B) Immunohistochemical results at 24 h after the injection of vehicles (top row), Aβ1–40 oligomers (middle row), and protofibrils (bottom row) to the bilateral hippocampal CA1 regions. DAPI (left column), 4G8 immunostaining (middle column), and magnification of CA1 regions (right column) are shown. (C) Quantification of 4G8-positive amyloid plaques in the hippocampal CA1 region (n = 4 mice per group). Data represent mean ± SEM (***p < 0.001).
