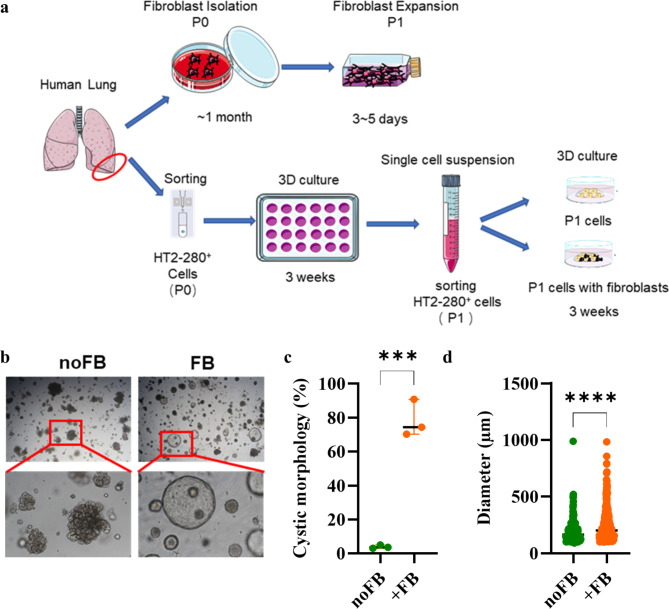
Fig. 1.
Fibroblasts induce cystic organoid growth. (a) Scheme of the experimental layout. (b) Representative phase contrast images of organoids cultured for 21 days (noFB: AT2 cells cultured without fibroblasts (FB); FB: AT2 cells cultured in the presence of fibroblasts, P1: passage 1). (c) Quantification of the morphology of the alveolar organoids. Data were compared by unpaired t-test (***p < 0.001). Each data point represents an independent experiment. (d) Quantification of the diameter of the alveolar organoids. Pooled results from 3 independent experiments. Data were compared by Mann-Whitney test (****p < 0.0001)

