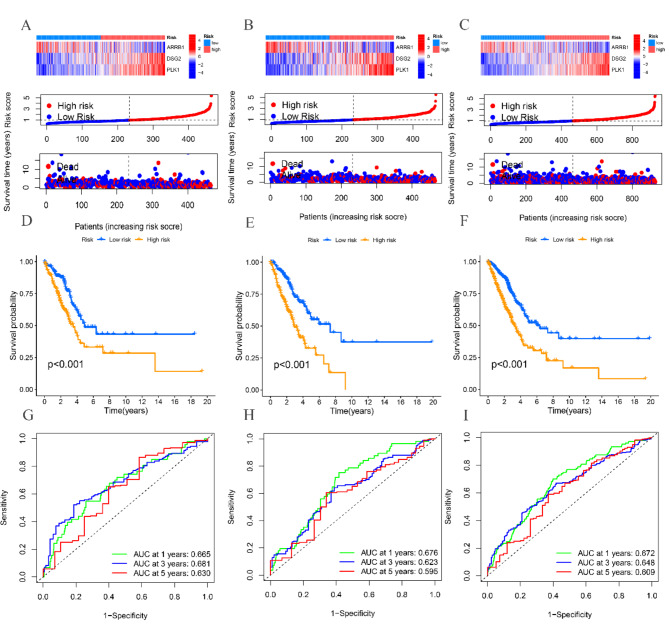
Fig. 3.
Construction and validation of the RRTGs risk score model. (A) Heat map and the risk point plot of model gene expression in the high and low-risk groups in the TCGA cohort. (B) Heat map and the risk point plot of model gene expression in the high and low-risk groups in the training set. (C) Heat map and the risk point plot of model gene expression in the high and low-risk groups in the test set. (D) KM survival curves for the high and low-risk groups in the TCGA cohort. (E) KM survival curves for the high and low-risk groups in the training set. (F) KM survival curves for the high and low-risk groups in the test set. (G) ROC curves for the high and low-risk groups in the TCGA cohort. (H) ROC curves for the high and low-risk groups in the training set. (I) ROC curves for the high and low-risk groups in the test set

