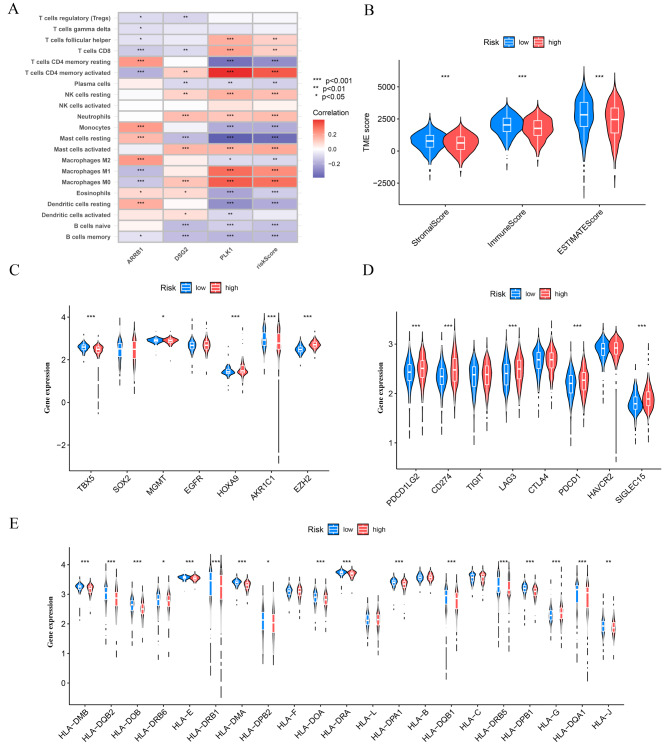
Fig. 5.
The immune microenvironment was different between the low and high-risk groups. (A) Heat map of immune cell correlation analysis in the high and low-risk groups. (B) Sample tumor purity was assessed by ESTIMATE with the estimated, immune, and stromal scores. (C) Immune checkpoint-related genes in the high and low-risk groups-Violin diagram. (D) Chemoradiotherapy-related genes in the high and low-risk groups-Violin diagram. (E) HLA-related genes in the high and low-risk groups-Violin diagram. *p < 0.05, **p < 0.01, and ***p < 0.001

