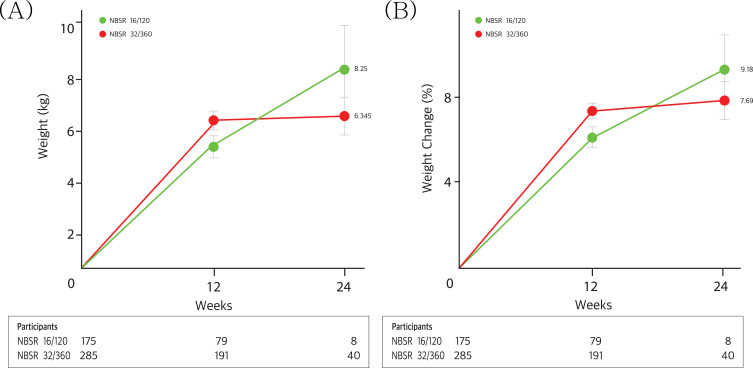
Figure 2.
Weight change in patients with a 24-week follow-up. Panels A and B show the observed mean percentage change (A) and kilogram (B) from baseline in body weight over time among participants in the full analysis population. I bars indicate one standard errors. The participants are the numbers of participants with available data contributing to the means at each visit.

