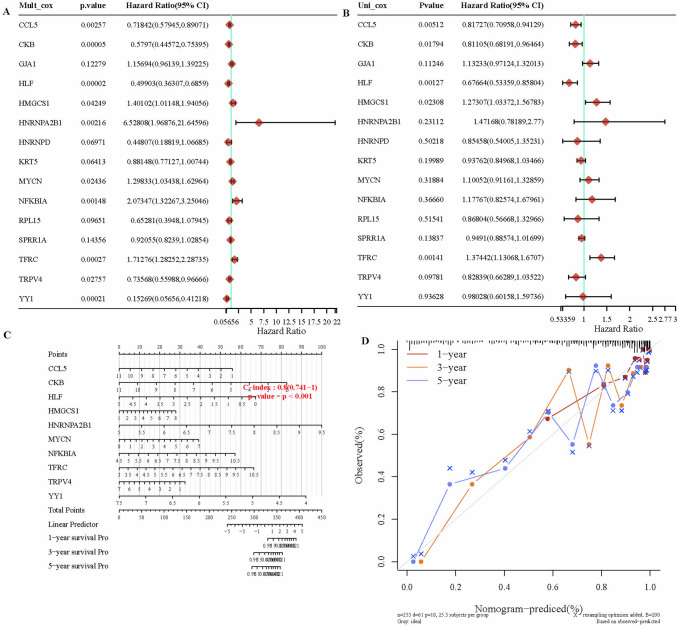
Fig. 10.
Prognostic model analysis. A, B Univariate and multivariate Cox analyses of gene expression and clinical features, detailing the P-values, hazard ratios (HR), and confidence intervals. C Nomograms predicting the 1-year, 2-year, and 3-year overall survival of cervical cancer patients. D Calibration curves of the overall survival nomogram model in the discovery group. The diagonal dashed line represents the ideal nomogram, while the blue, red, and orange lines represent the observed 1-year, 2-year, and 3-year nomograms, respectively. *P < 0.05. **P < 0.01. ***P < 0.001. ****P < 0.0001

