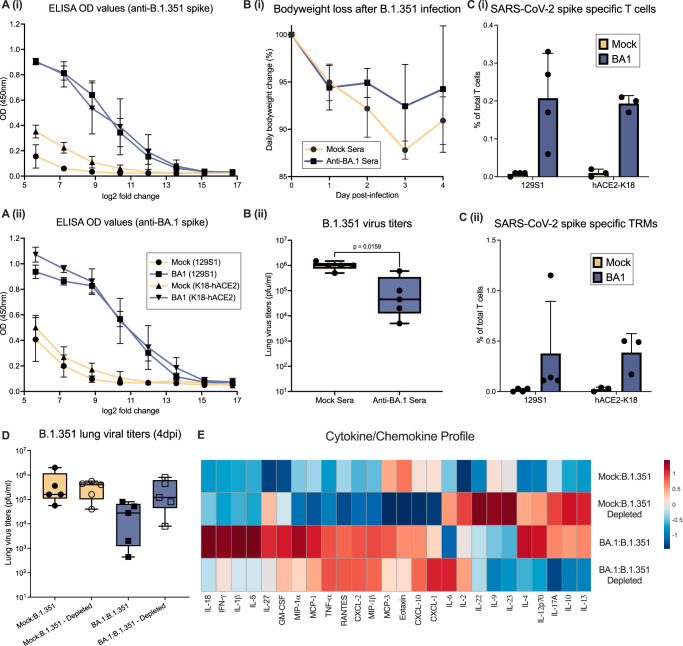
Fig. 3. Differences in adaptive immune responses upon BA.1 infection do not explain differences in re-infection outcomes.
A Line graph showing ELISA results in transformed Log2 fold dilutions (x-axis) of 30 DPI serum from K18-hACE2 (n = 4) and 129S1 (n = 5) versus mean ±SD OD values at 450 nm (y-axis) against B.1.351 spike (i) or BA.1 spike (ii) protein. B (i): Mean ±SD weight change in 129S1 mice inoculated with 104 PFU of B.1.351 after passive immunization with either mock (n = 5) or ant-BA.1 serum (n = 5). B (ii): Infectious virus titers in lungs from passive immunized 129S1 mice with either mock (n = 5) or ant-BA.1 serum (n = 5) 4 DPI after B.1.351 inoculation. Representation: Box-plot with median as center, 25th to 75th percentile-bound box and whiskers representing maximum and minimum values. Statistical analysis: Two-tailed Mann–Whitney T-test. C (i): Spike-specific T-cells as percentage (mean±SD) of total T cells in murine lungs at 30 DPI after BA.1 or mock challenge (129S1 mice n = 4 per group, K18-hACE2 mice n = 3 per group). C (ii): Spike-specific tissue resident memory T-cells as percentage (mean±SD) of total T cells in murine lungs at 30 DPI after BA.1 or mock challenge (129S1 mice n = 4 per group, K18-hACE2 mice n = 3 per group). D: B.1.351 lung viral titers 4 DPI in 129S1 mice pre-exposed or not to BA.1, either T-cell depleted or immunocompetent (n = 5, per group). Representation: see B(ii), E Heatmap graph of cytokine/chemokine profile of lung homogenates from mock or BA.1 pre-infected 129S1 mice, either T-cell depleted or not, inoculated with either 104 PFU of B.1.351. Z-score calculations from Net-MFI results are represented in the heatmap (n = 5, per group). Mann–Whitney t-test was used to determine statistical significance of the results, where exact p-values are presented. Source data are provided as a Source Data file.

