Fig. 3.
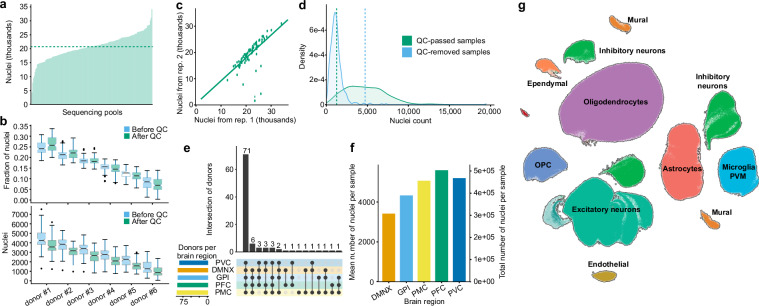
Analysis of snRNA-seq dataset. (a) Distribution of the number of nuclei across sequencing pools. Horizontal dashed line denotes a mean value. (b) Distribution of nuclei to replicates within pools, ordered by cell count. Each replicate is depicted using two boxplots representing the nuclei distribution before and after QC. The center line (black) indicates the median, the box shows the interquartile range, and the whiskers indicate the highest/lowest values within 1.5× the interquartile range. (c) Comparison of QC-passed nuclei counts between pairs of replicates from the same pools shows high consistency (Spearman’s ρ=0.79). (d) Distribution of nuclei counts in samples that passed or failed QC (vertical line indicates the mean values). (e) Sample counts and intersections among brain regions. (f) nuclei distribution across five brain regions. The left y-axis shows the average number of nuclei per sample for each region, while the right y-axis indicates the total number of nuclei detected in all samples from each region. (g) UMAP visualization of single nuclei defined by RNA-seq data shows eight major cell type clusters that are expected to be presented in the investigated brain regions.

