Fig. 2.
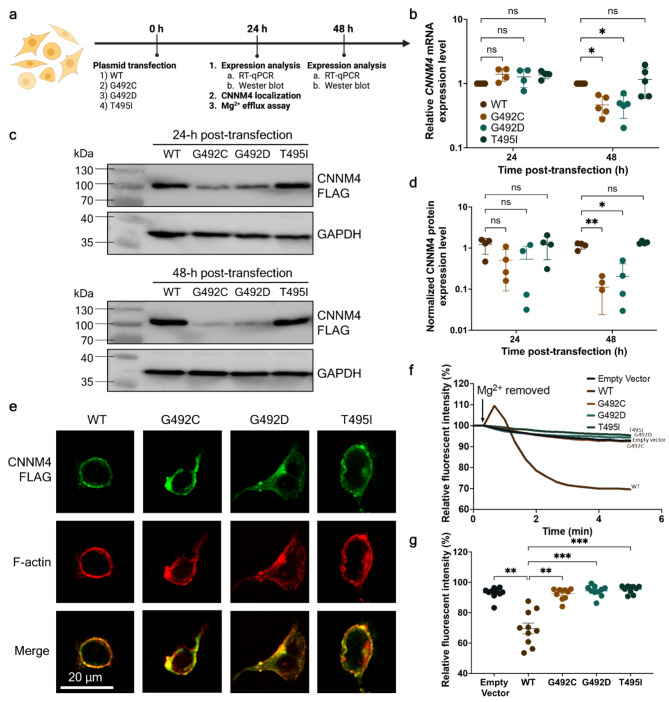
Functional characterization of wild-type p.(Gly492), p.(Gly492Cys), p.(Gly492Asp), and p.(Thr495Ile) CNNM4 protein. (a) Experimental workflow for the functional study of overexpressed wild-type and mutant CNNM4 mRNA and CNNM4 protein. Time points for these experiments were set at 0-, 24-, and 48-hours post-plasmid transfection (created with BioRender.com). (b) Relative mRNA levels of wild-type and mutant CNNM4 at 24- and 48-hours post-transfection. Wild-type mRNA levels at both time points were arbitrarily set to 1, with results derived from four independent experiments (n = 4). (c) Western blot analysis of wild-type and mutant CNNM4 protein at 24- and 48-hours post-transfection. GAPDH was used as a loading control. For (b) and (c), individual data points are presented with means and standard errors. Two-way ANOVA was performed to assess the statistical differences between wild-type and mutant mRNA and protein levels (*p < 0.05, **p < 0.005). (d) Expression levels of wild-type and mutant proteins at 24- and 48-hours post-transfection, with FLAG-tagged CNNM4 protein band intensities normalized to GAPDH. The results are from four independent experiments (n = 4). (e) Localization of overexpressed CNNM4-FLAG in the HEK293 cell line, visualized using immunofluorescence. The green signal indicates the localization of wild-type and mutant FLAG-tagged CNNM4 proteins, while the red signal indicates F-actin location. Merged signals were examined for co-localization (scale bar = 20 μm). (f) Mg2+ extrusion assay: Line plot depicting the average percentage of relative fluorescent intensity over time (minutes) (n = 10), with the initial intensity set to 100%. (g) Remaining fluorescent intensity at 5 min relative to the initial intensity. Individual data points are shown with means and standard errors. The non-parametric Kruskal-Wallis test was conducted to evaluate the statistical differences between the relative fluorescent intensities of wild-type and mutant proteins (n = 10, **p < 0.005, ***p < 0.001).

