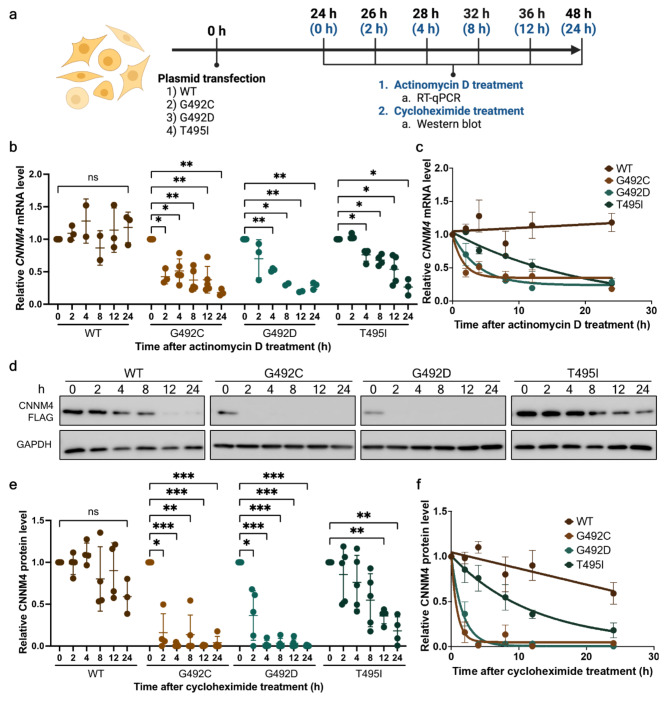
Fig. 3.
Determination of the wild-type and mutant mRNA and protein turnover rates. (a) Experimental workflow for determining the decay rates of wild-type and mutant CNNM4 mRNA and CNNM4 protein (created with BioRender.com). Black time points represent the duration post-transfection (0–48 h), while blue time points indicate the intervals following treatment with actinomycin D or cycloheximide. (b) Relative levels of wild-type and mutant CNNM4 mRNA after actinomycin D treatment at 0, 2, 4, 8, 12, and 24 h. mRNA levels at 0 h were arbitrarily set to 1. Results at 24 and 48 h were derived from four and five independent experiments, respectively. (c) Data from (b) were fitted to a one-phase decay model to determine the mRNA half-lives. Means and standard deviations are indicated along the fitted decay lines. (d) Western blot analysis results for wild-type and mutant CNNM4 proteins at 24- and 48-hours post-transfection, with GAPDH serving as a loading control. (e) Quantification of wild-type and mutant CNNM4 protein expression levels following cycloheximide treatment at 0, 2, 4, 8, 12, and 24 h. FLAG-tagged CNNM4 protein band intensities were normalized to GAPDH. The results are from four independent experiments (n = 4). (f) Data from (e) were fitted to a one-phase decay model to calculate protein half-lives. Means and standard deviations are shown along the fitted decay trends. For (b) and (e), individual data points are plotted with means and standard deviations. Two-way ANOVA was conducted to assess the statistical differences between wild-type and mutant mRNAs (*p < 0.05, **p < 0.005, ***p < 0.001).

