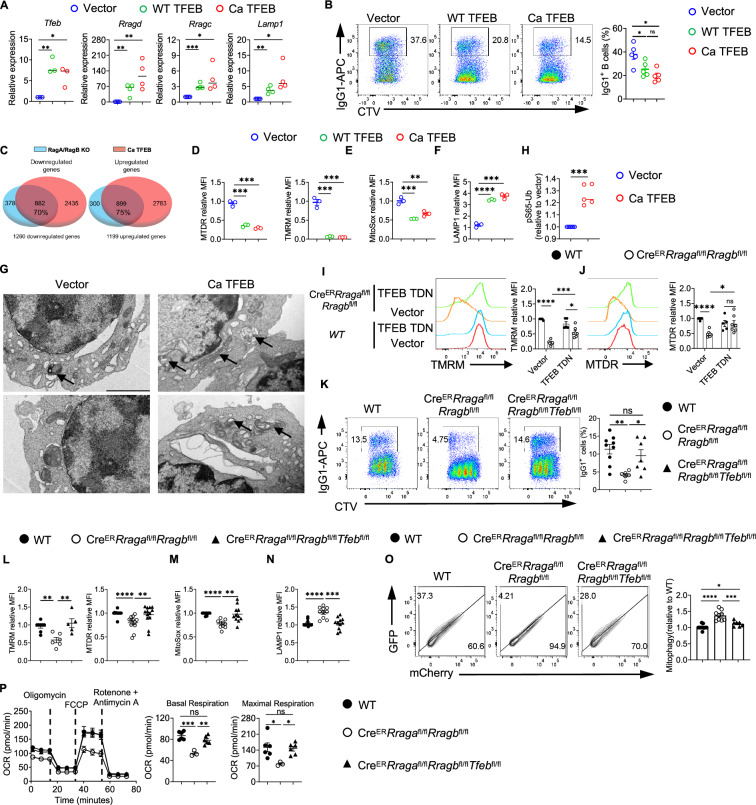
Fig. 6. TFEB/TFE3 overactivation is responsible for the abnormal mitophagy and impaired mitochondrial fitness in RagA/RagB deficient B cells.
A qRT-PCR of Tfeb, Rragd, Rragc, and Lamp1 expression. GFP+ B cells were sorted from vector, WT TFEB, and Ca TFEB transduced B cells. B Expression of IgG1 and Celltrace violet (CTV) in transduced B cells. n = 4 for each group. C Venn diagrams highlight the overlapping gene numbers in downregulated DEGs (left) and upregulated DEGs (right) between Rag KO vs WT comparison and Ca TFEB vs vector comparison. D Summaries of the relative MTDR (left) and TMRM (right) MFIs. n = 3 for each group. E Summary of the relative MitoSox MFIs. n = 3 for each group. F Summary of the relative LAMP1 MFIs. n = 3 for each group. G Transmission electron microscope (TEM) of sorted vector or Ca TFEB transduced B cells. Arrows indicate mitochondria surrounded by double-layer structures. scale bar, 2 μm. (H) ELISA of pS65-Ub levels in sorted vector or Ca TFEB transduced B cells. n = 5 for each group. Flow cytometry of TMRM (I) or MTDR (J) staining of vector or TFEB TDN transduced B cells. WT (n = 5), CreERRragafl/flRragbfl/fl (n = 7). K Flow cytometry of IgG1 and CTV. B cells from indicated genotypes were activated with LPS/IL-4/BAFF for 3 days. TMRM or MTDR (L), MitoSox (M), or LAMP1 (N) were measured by flow cytometry. O GFP and mCherry expression in B cells with Mito-QC transduction. P B cells from the indicated mice were purified and activated with LPS/IL-4/BAFF for 72 h. Mito stress assay was performed on a Seahorse XFe96 analyzer. Right, summaries of the basal respiration and maximal respiration. Data in graphs represent mean ± SEM. ns, not significant. *p < 0.05, **p < 0.01, ***p < 0.001, and ****p < 0.0001, one-way ANOVA (A, B, D–F, K–P), two-way ANOVA (I and J), two-tailed/unpaired Student’s t-test (H). Source data are provided as a Source Data file.

