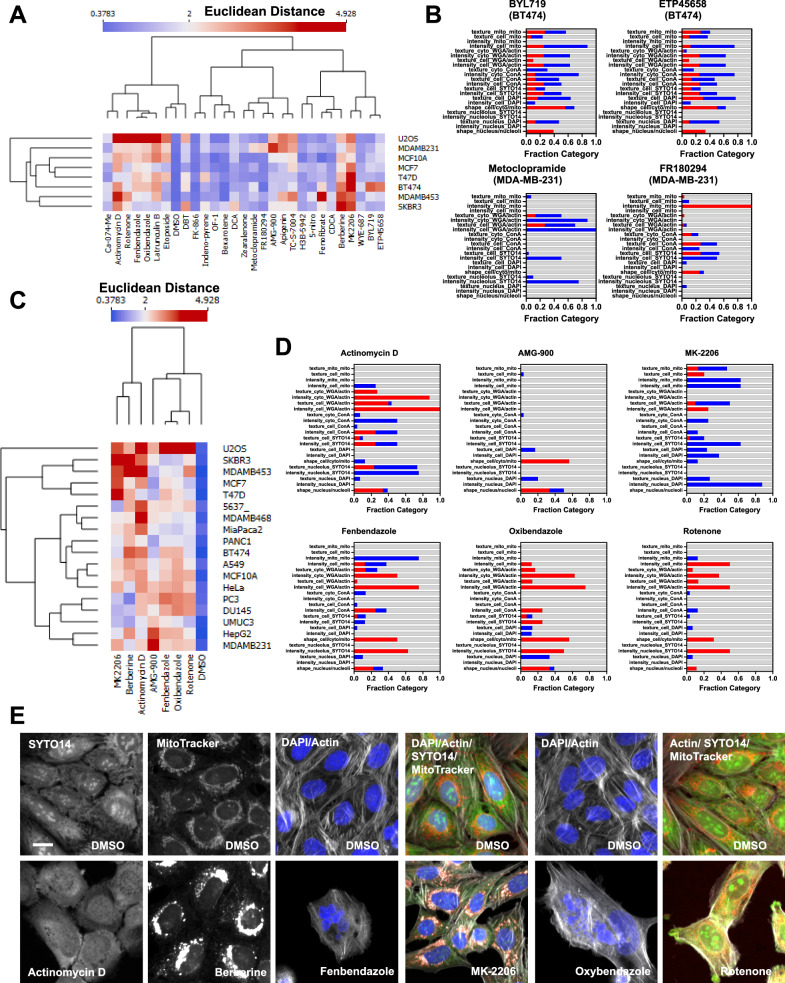
Fig. 4. Testing SPACe on a set of breast cancer models.
A Cell lines were treated with 28 chemicals for 24 h and then analyzed with SPACe. The heatmap shows the Euclidean distance of each compound from the DMSO wells of each cell line. B Stacked bar graphs showing the interpretability profile of four cell line specific hit chemicals with increased features in red, decreased in blue, and unchanged in gray. C Eighteen cell lines were treated with the indicated compounds for 24 h and then Euclidean distance was calculated and represented as a heatmap. D Stacked bar graphs showing tentative “consensus fingerprints” of the changing features across a minimum of five cell lines, with increased features in red, decreased in blue, and unchanged in gray. E Selected images (zoom in from 20×/1.0 images) from one out of three independent biological replicates to showcase specific phenotypic changes caused by the indicated compounds in highlighted channels/compartments. Scale bar: 10 µm. Source data are provided as a Source Data file.

