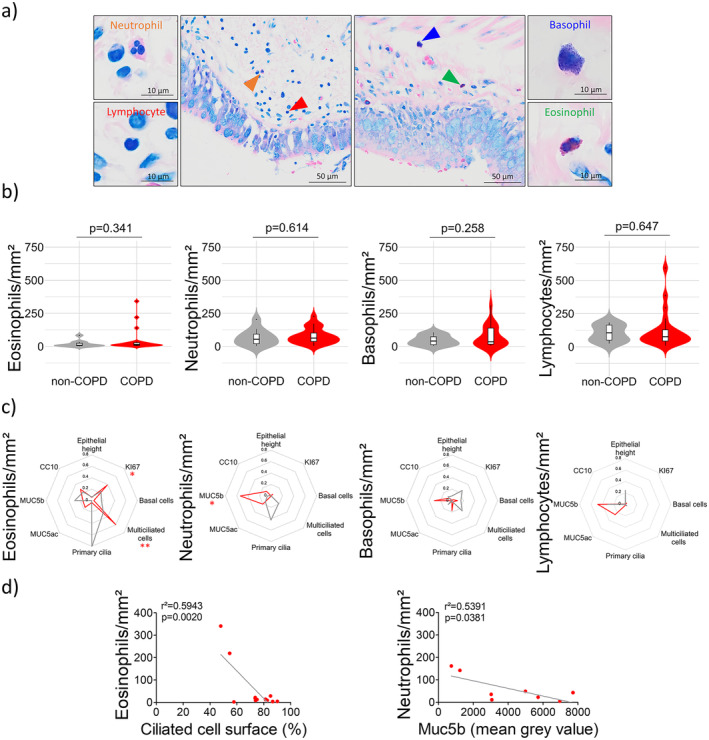
FIGURE 1.

Quantitative analysis of peribronchial neutrophils, lymphocytes, basophils and eosinophils in COPD lung tissues. (a) Example of a microscopic acquisition showing peribronchial accumulation of neutrophils (orange arrow), lymphocytes (red arrow), basophils (blue arrow) and eosinophils (green arrow) in an MGG‐stained FFPE lung resection from a COPD patient. (b) Violin plots showing eosinophil, basophil, neutrophil and lymphocyte counts in the peribronchial regions of COPD (n = 23) and non‐COPD patients (n = 11). The markers for the median and the box indicating the interquartile range are shown in black. (c) Radar charts displaying the square of the Pearson correlation r for the multivariate epithelial remodelling features in non‐COPD (grey lines, n = 4–8) and COPD patients (red lines, n = 8–13) regarding eosinophil, basophil, neutrophil and lymphocyte counts. *p < 0.05, **p < 0.01 in COPD patients. (d) Dot plots showing linear regressions for COPD patients (n = 8–11) regarding eosinophil and neutrophil counts for the ciliated cell surface and Muc5b.
