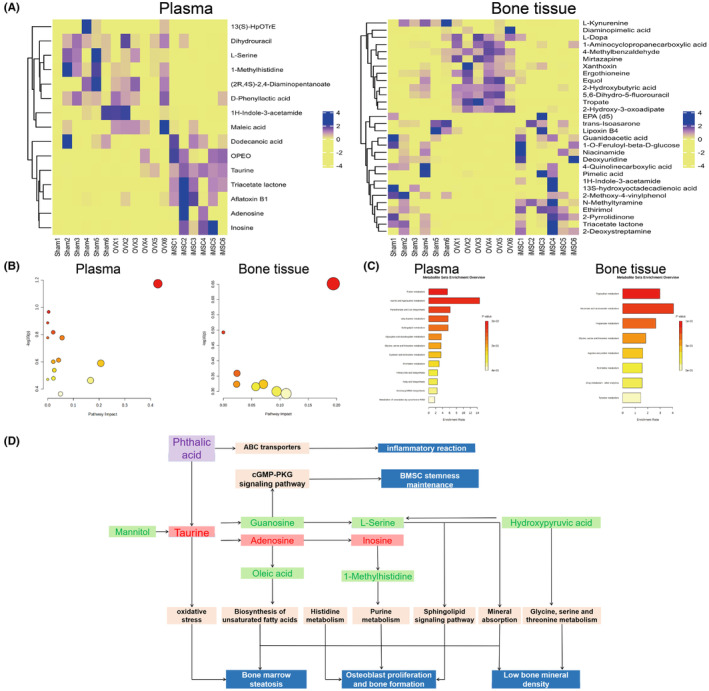
FIGURE 6.

Heatmap and Metaboanalyst pathway enrichment analysis of bone tissue and plasma biomarkers. (A) Heatmap analysis of biomarkers; blue and yellow indicate increased and decreased levels, respectively; (B) Analysis of metabolic pathway impact; (C) Overview of metabolite enrichment; (D) Interaction of metabolic pathways and biological phenotype of relevant metabolites screened based on iMSCs intervention.
