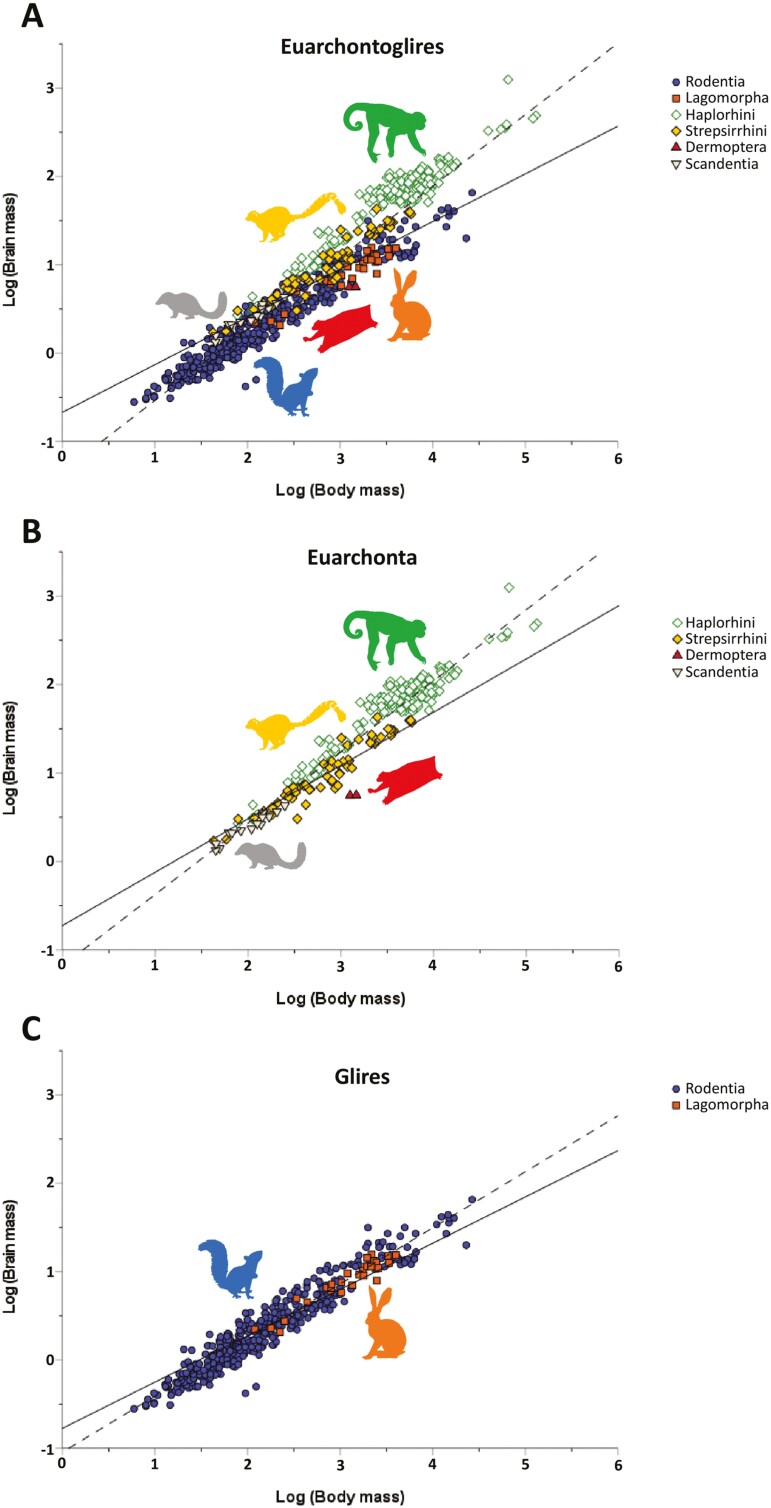
Fig. 1.
Bivariate plots of log brain mass versus log body mass for euarchontogliran species. Points are color-coded by order, except for Primates, which are divided into the suborders Haplorhini and Strepsirrhini. Best fit lines are shown for the OLS (dashed) and PGLS (solid) regressions. (A) Data for the entire sample, with the best fit line for Euarchontoglires (OLS slope = 0.809, intercept = −1.344; PGLS slope = 0.540, intercept = −0.670); (B) data for members of Euarchonta (Primates, Dermoptera, Scandentia; OLS slope = 0.805, intercept = −1.177; PGLS slope = 0.603, intercept = −0.724); (C) data for members of Glires (Rodentia, Lagomorpha; OLS slope = 0.635, intercept = −1.044; PGLS slope = 0.524, intercept = −0.774).

