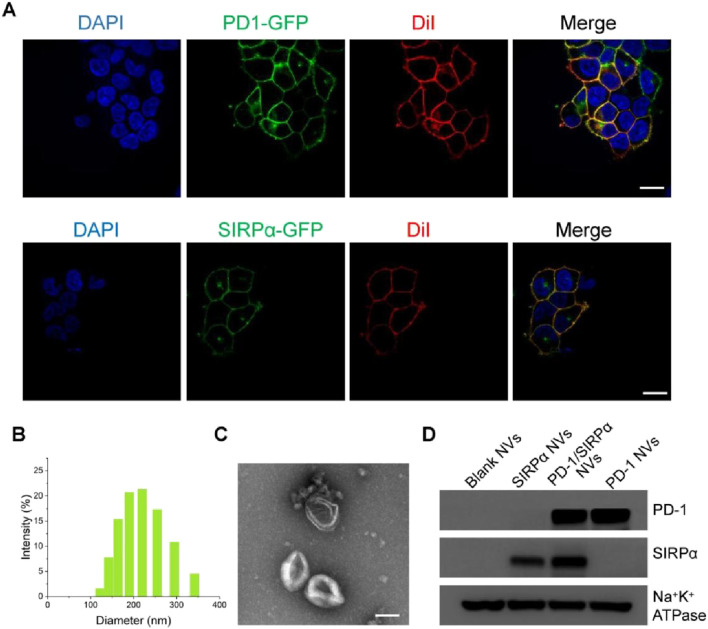
FIGURE 1.
Preparation and characterization of PD-1/SIRPα NVs. (A) Confocal microscopy images of PD-1 and SIRPα stable cell lines. Stable cell lines were obtained by transfecting lentiviral vectors carrying PD-1-GFP or SIRPα-GFP through limited dilution. The cell membranes were stained with the membrane dye Dil (red). Scale bar: 10 μm. (B) Size distribution of PD-1/SIRPα NVs in PBS solution determined by dynamic light scattering (DLS). (C) Morphology analysis of PD-1/SIRPα NVs by TEM. Scale bar: 100 nm. (D) Western blot analysis of PD-1 and SIRPα protein expression in hybrid nanovisicles. Na+K+ ATPase was used as a positive control for membrane protein retained in cell membrane nanovesicles.

