Figure 1.
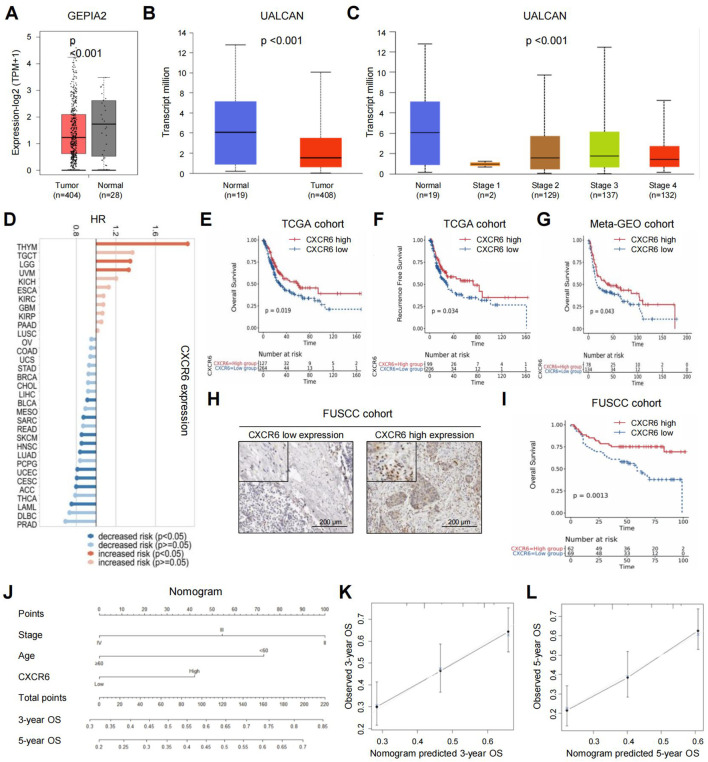
High CXCR6 expression predicts favorable outcomes in MIBC patients. (A) CXCR6 expression in bladder cancer tissues versus normal tissues using GEPIA2. (B) CXCR6 expression in bladder cancer tissues versus normal tissues using UALCAN. (C) CXCR6 expression in different stages of bladder cancer using UALCAN. (D) Forest plot of OS prognostic analysis for CXCR6 in pan-cancer using TISCH2. (E–G) Kaplan–Meier survival curves showing the association between CXCR6 expression and patient outcomes in the TCGA database (E, F) and meta-GEO database (G). (H) Representative images of high and low CXCR6 expression in the FUSCC cohort. (I) Kaplan–Meier survival curves showing the association between CXCR6 expression and OS in the FUSCC cohort. (J) Nomogram predicting the 3- and 5-year OS for MIBC patients after surgery. (K, L) Calibration plots for 3-year (K) and 5-year (L) OS predictions following surgery.

