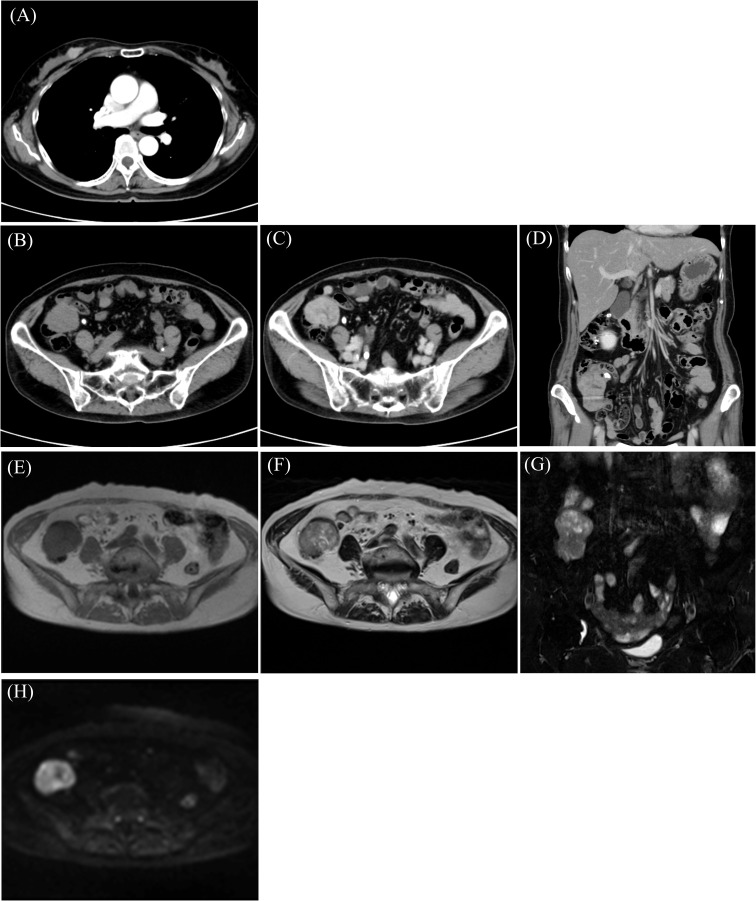
Figure 1.
Computed tomography (CT) shows a mass with enhancement in the breast (A) and ileocecal region (B) with enhancement (C, D). Magnetic resonance imaging (MRI) reveals an iso-intensity signal compared to the muscle on T1-weighted imaging (T1WI) (E), a slightly high signal on T2-weighted imaging (T2WI) (F) and T2-fat-suppressed (T2FS) (G), and high signal on diffusion-weighted imaging (DWI) (H).

