Figure 2.

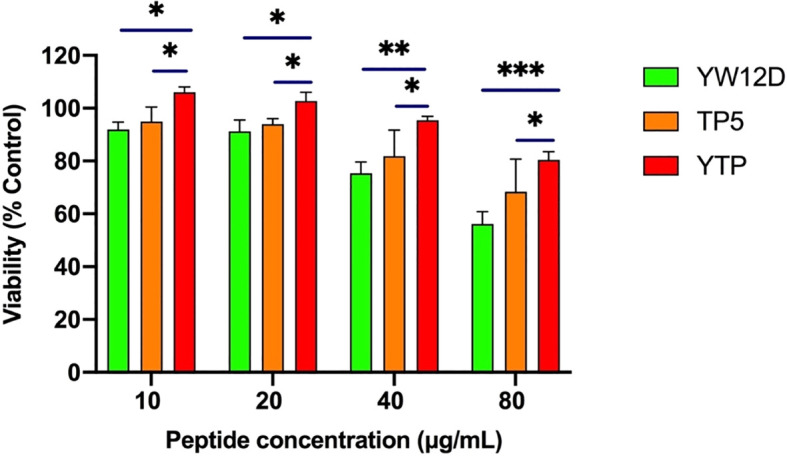
Cell viability of RAW264.7 macrophages. The data are presented as the mean ± SEM (n=8). NS: P > 0.05, *: P ≤ 0.05, **: P ≤ 0.01, and ***: P ≤ 0.001.

Cell viability of RAW264.7 macrophages. The data are presented as the mean ± SEM (n=8). NS: P > 0.05, *: P ≤ 0.05, **: P ≤ 0.01, and ***: P ≤ 0.001.