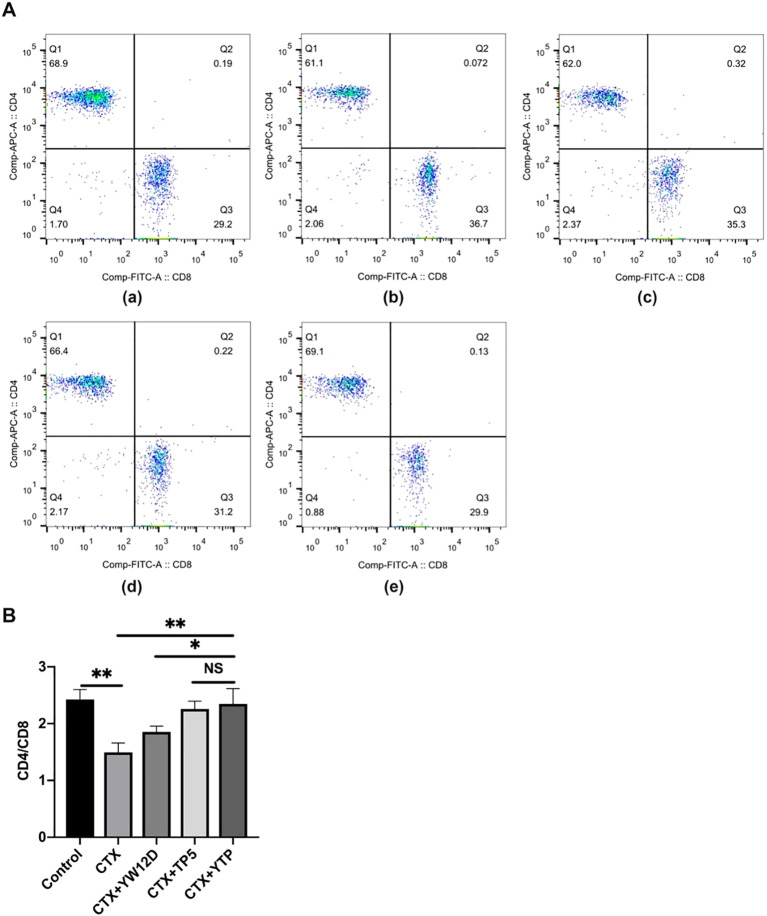
Figure 6.
Effects of YW12D, TP5, and YTP on T lymphocyte subpopulations. (A) The percentage of different T cell subsets was analyzed by flow cytometry. (A-a) Control, (A-b) cyclophosphamide (CTX), (A-c) CTX + YW12D, (A-d) CTX + TP5, (A-e) CTX + YTP. Bivariate plots showed representative independent assessments, which were quantified and plotted as the CD4+:CD8+ ratio in (B). The mean ± SEM (n = 12) is used to express the data. NS: P > 0.05, *: P ≤ 0.05, and **: P ≤ 0.01.

