
FIGURE 2.
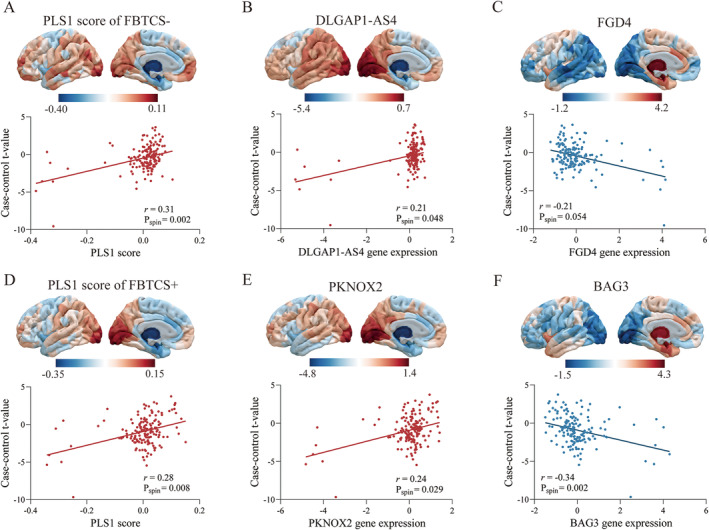
Association between regional gene expression profiles and case–control differences of gray matter volume. (A) The scatter plot shows the regional PLS1 scores was correlated with case–control t‐values in left hemisphere of FBTCS−, with each dot representing a brain region. (B) The regional expression of the most positively weighted gene in left hemisphere and the correlation with case–control t‐value of FBTCS−. (C) The most negatively weighted gene and the negative correlation with case–control t‐value of FBTCS−. (D) The regional PLS1 scores and was positively correlated with case–control t‐value in left hemisphere of FBTCS+. (E) The regional expression of the most positively weighted gene in left hemisphere and was positive correlated with case–control t‐value of FBTCS+. (F) The regional expression of the most negatively weighted gene and was negatively correlated with case–control t‐value of FBTCS+. FBTCS−, without focal to bilateral tonic–clonic seizures; FBTCS+, with focal to bilateral tonic–clonic seizures; PLS1, the first component of the PLS analysis.