
FIGURE 4.
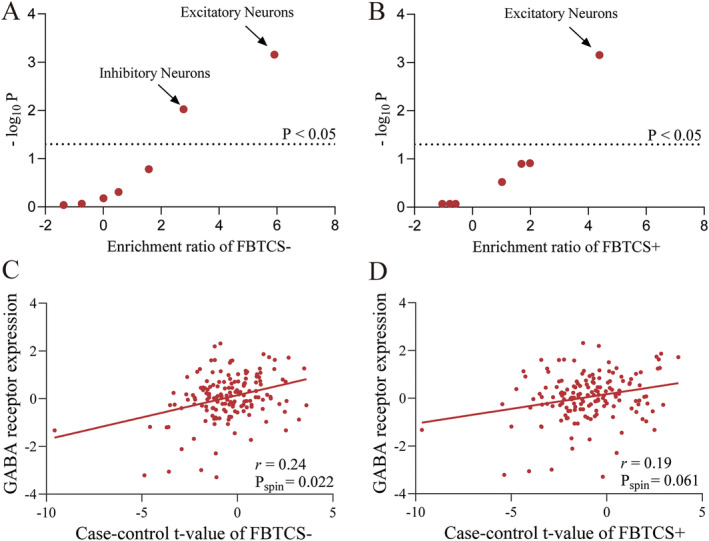
Cell type enrichment of PLS+ genes and correlation between regional GABA receptor expression and case–control t‐value. (A) Excitatory and inhibitory neurons were significantly enriched in FBTCS− patients. (B) Only excitatory neurons were significantly enriched in in FBTCS+ patients. (C) The scatter plot shows the regional GABA receptor expression was significantly correlated with case–control t‐value of FBTCS−, with each dot representing a brain region. (D) No significant correlation was found between GABA receptor expression and case–control t‐value of FBTCS+. FBTCS−, without focal to bilateral tonic–clonic seizures; FBTCS+, with focal to bilateral tonic–clonic seizures.