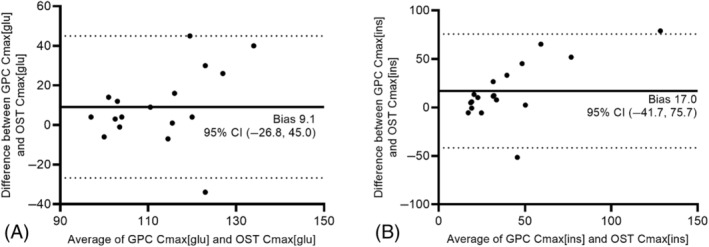
FIGURE 4.

Bland‐Altman plots showing the effect of test modality on maximum glucose concentration (Cmax[glu]; A) and maximum insulin concentration (Cmax[ins]; B) in 18 horses that underwent both tests. Calculated bias is shown on all graphs as a solid line; the dotted lines mark the limits of each 95% confidence interval (CI).
