
FIGURE 1.
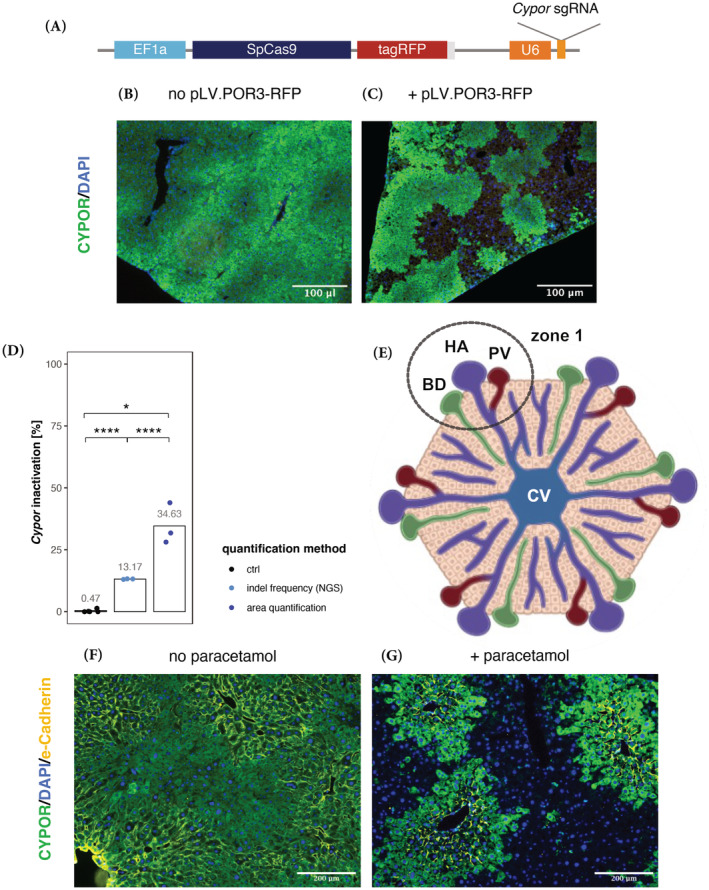
Selective perivenous‐liver cell replacement upon Cas9‐induced Cypor inactivation in wild‐type mice. (A) Schematic of the lentiviral vector plasmid pLV.POR3‐RFP encoding SpCas9‐tagRFP under the control of the ubiquitous EF1a promoter, and anti‐Cypor gRNA controlled by the U6 promoter. (B) Liver staining of CYPOR expression in control wild‐type mice treated with 13 paracetamol doses (no pLV.POR3‐RFP vector administration; n = 2 mice). (C) Liver staining of CYPOR in wild‐type mice (n = 3) treated with pLV.POR3‐RFP vector, administered via HTV, and selected with 15 paracetamol doses (scale bars, 100 μm; n = 3 mice). (D) Percentage of Cypor‐inactivated gene copies detected using next generation sequencing (NGS) or microscopy areal quantification. (E) Schematic representation of a liver lobule, that is, a collection of hepatocytes in a hexagonal shape with the center being a central vein (CV) in zone 3 while zone 1 contains the portal triad with bile duct (BD), hepatic artery (HA), and the portal vein (PV). (F,G) Representative liver staining for CYPOR and e‐Cadherine of pLV.POR3‐RFP vector (HTV) treated mouse, without paracetamol selection (F), and after 20 paracetamol doses (G; scale bars 200 μm. Green = CYPOR; yellow = e‐Cadherin (periportal); blue = nucleus (DAPI). Statistics: unpaired t‐test compared to ctrl and paired t‐test comparing both quantification methods, *p < 0.05, **p < 0.01, ***p < 0.001, ****p < 0.0001). E‐Cadherin is specifically localized in the periportal‐zone where hepatocytes are not replaced by paracetamol treatment as they do not express CYPOR. Note that although we used a LV vector expressing CYPOR‐RFP, anti‐RFP AB was not used for liver staining due to the strong red auto‐fluorescence of liver tissue.