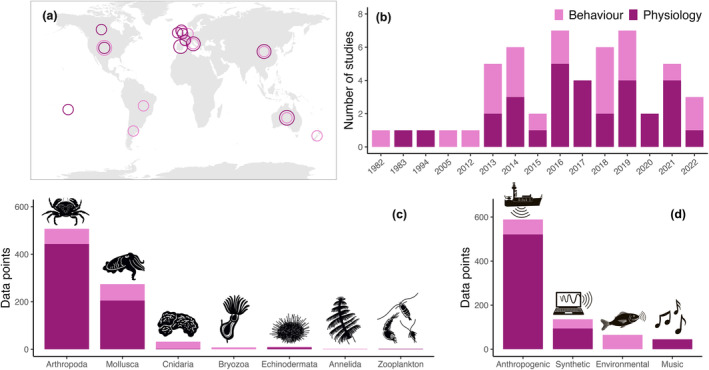
FIGURE 2.

The spatiotemporal coverage and data composition of the 46 studies included in the meta‐analysis. Behavioral data are light pink, and physiological data are dark pink—in the five cases where single studies included both behavioral and physiological data, they were plotted as separate points. (a) The 15 countries where the research was conducted. Circle size is proportional to the density of studies (the number of studies in each country as follows: Argentina 1, Australia 7, Brazil 1, Canada 1, China 5, England 2, France 3, French Polynesia 2, Ireland 1, Italy 5, Netherlands 2, New Zealand 1, Spain 5, United Kingdom 3, and United States 7). (b) The number of studies published in each year (years with zero studies are not shown). (c) The number of data points corresponding to each invertebrate taxonomic group. (d) The number of data points included within each sound source category.
