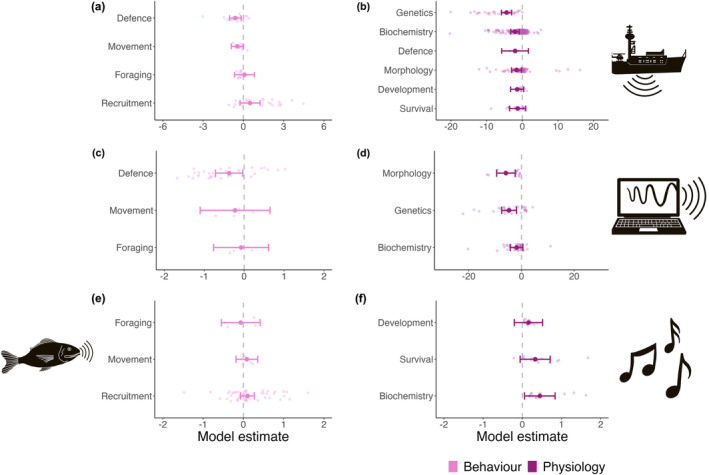
FIGURE 4.

Model estimates and 95% confidence intervals (CIs) of the behavioral (light pink) and physiological (dark pink) responses of aquatic invertebrates to sounds, derived from meta‐analytic multivariate mixed‐effect models which evaluated responses to (a) and (b) anthropogenic noise, (c) and (d) synthetic sounds, (e) environmental sounds, and (f) music. Points illustrate the transformed effect size data that were used in each model. The vertical dotted line indicates an effect size of zero and non‐overlapping 95% CIs are significant.
