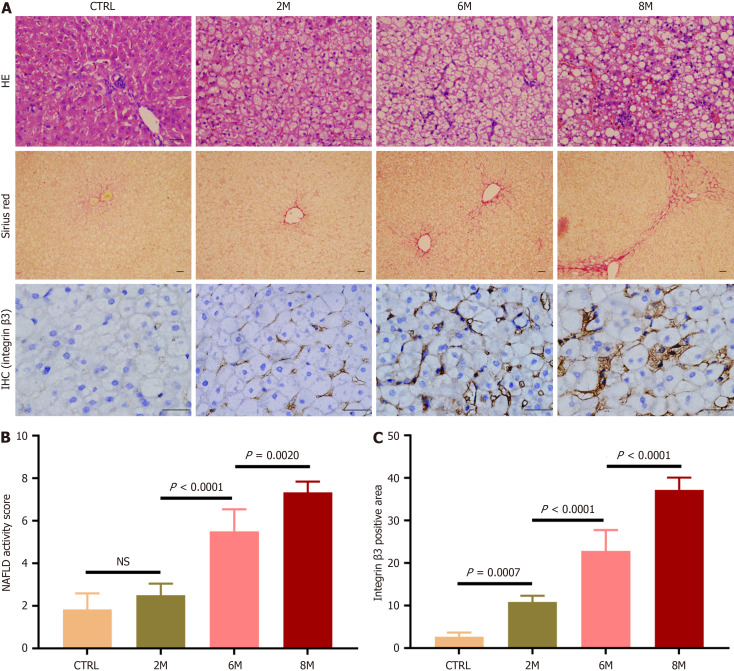
Figure 2.
Expression of integrin αvβ3 in livers of rabbits with non-alcoholic fatty liver disease. Non-alcoholic fatty liver disease was induced in rabbits by high-fat diet (HFD) for 2, 6, and 8 months (referred to as HFD-2M, 6M and 8M), and rabbits fed with regular diet for 8 months served as the control group (n = 6 per group). A: Representative micrographs of hepatic histology stained with hematoxylin-eosin staining (200 ×), Sirius red (100 ×), and immunohistochemistry for integrin β3 subunit (400 ×). In immunohistochemistry staining images, the brown areas indicated integrin β3 subunit positive staining, scale bars = 50 μm; B: Comparison of non-alcoholic fatty liver disease activity score in the control and HFD-fed rabbits; C: Comparison of the percentage of integrin β3 subunit positive-staining area in liver sections of the control and HFD-fed rabbits. For semi-quantitative analysis of hepatic integrin αvβ3 expression level, 10 fields were randomly selected and recorded from each section stained with immunohistochemistry for integrin β3 subunit. Then integrin β3 subunit positive-staining area was measured, and the percentages of the positive-staining area in liver sections were compared. In all panels, data are expressed in means ± SD. IHC: Immunohistochemistry; HE: Hematoxylin-eosin staining; CTRL: Normal control group; M: Month; NS: Not significant; NAFLD: Non-alcoholic fatty liver disease.

