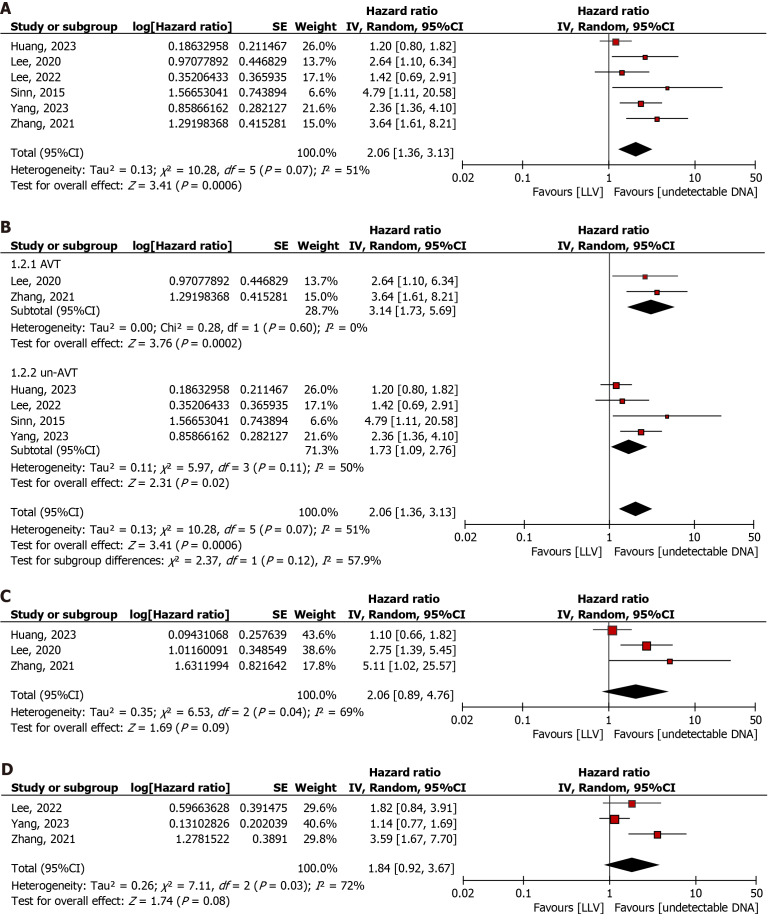
Figure 2.
Forest plot. A: Association between low-level viremia (LLV) and hepatocellular carcinoma (HCC); B: Subgroups stratified by the presence or absence of antiviral therapy; C: The association between LLV and hepatic decompensation; D: The association between LLV and liver-related clinical events. The diamond indicates the pooled estimate. Red boxes are relative to the study size, and the black vertical lines indicate the 95%CIs around the effect size estimate.

