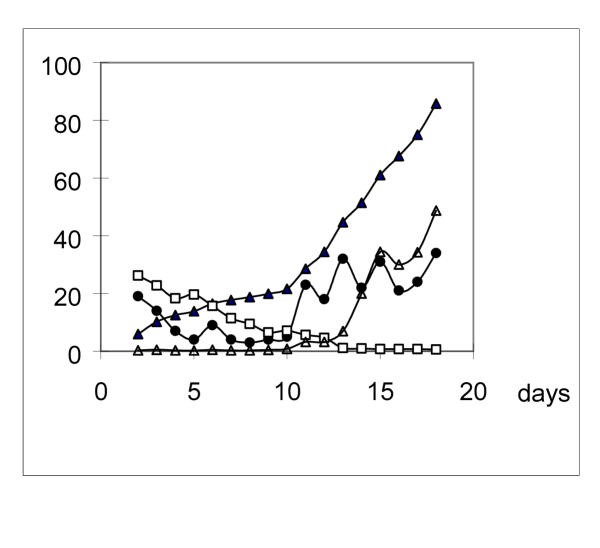
Figure 1.
Mutation rates increasing on leucine absent plates The rates were given as the number of leu+ revertants that appeared on a given day divided by the viable cells two days before. Solid triangle: Accumulation of leu+ revertants as papillae on colonies during leucine starvation. The data show the percent value of the ratio papillae per colony. Open square: Viable cells per colony with no papillae (107 cells/ml). Solid circle: Number of new mutations occurred during each day. Open triangle: mutation rates (10-8) in leucine starved colonies.

